NZD/USD Price Analysis: Bears tighten their grip and present battle at around 0.6000

Source Fxstreet
  • The daily RSI and MACD indicate diminishing buying momentum as bulls struggle to gain further ground.
  • The hourly indicators reveal that sellers have a slight upper hand ahead of the Asian session.

In Monday's session, the NZD/USD pair traded with mild losses, and sellers gained ground. As the pair is facing strong resistance at the 200-day Simple Moving Average (SMA), the pair struggles to consolidate advances. Indicators are flattening and indicate that the moment of the bulls may be coming to an end.

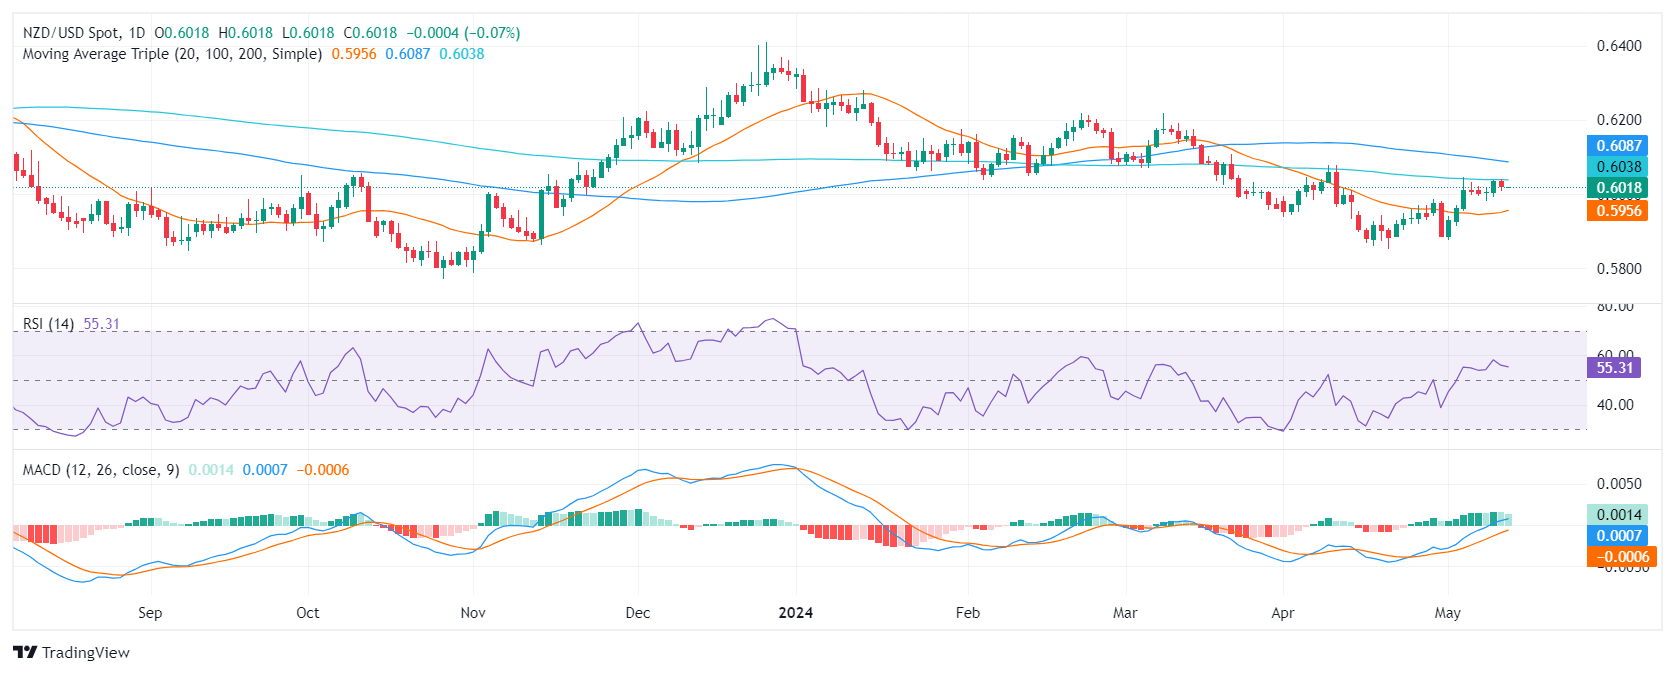
On the daily chart, the Relative Strength Index (RSI) shows a flattening traction above 50. At the same time, the Moving Average Convergence Divergence (MACD) histogram reveals a decrease in buying momentum, demonstrated by diminishing green bars.

NZD/USD daily chart

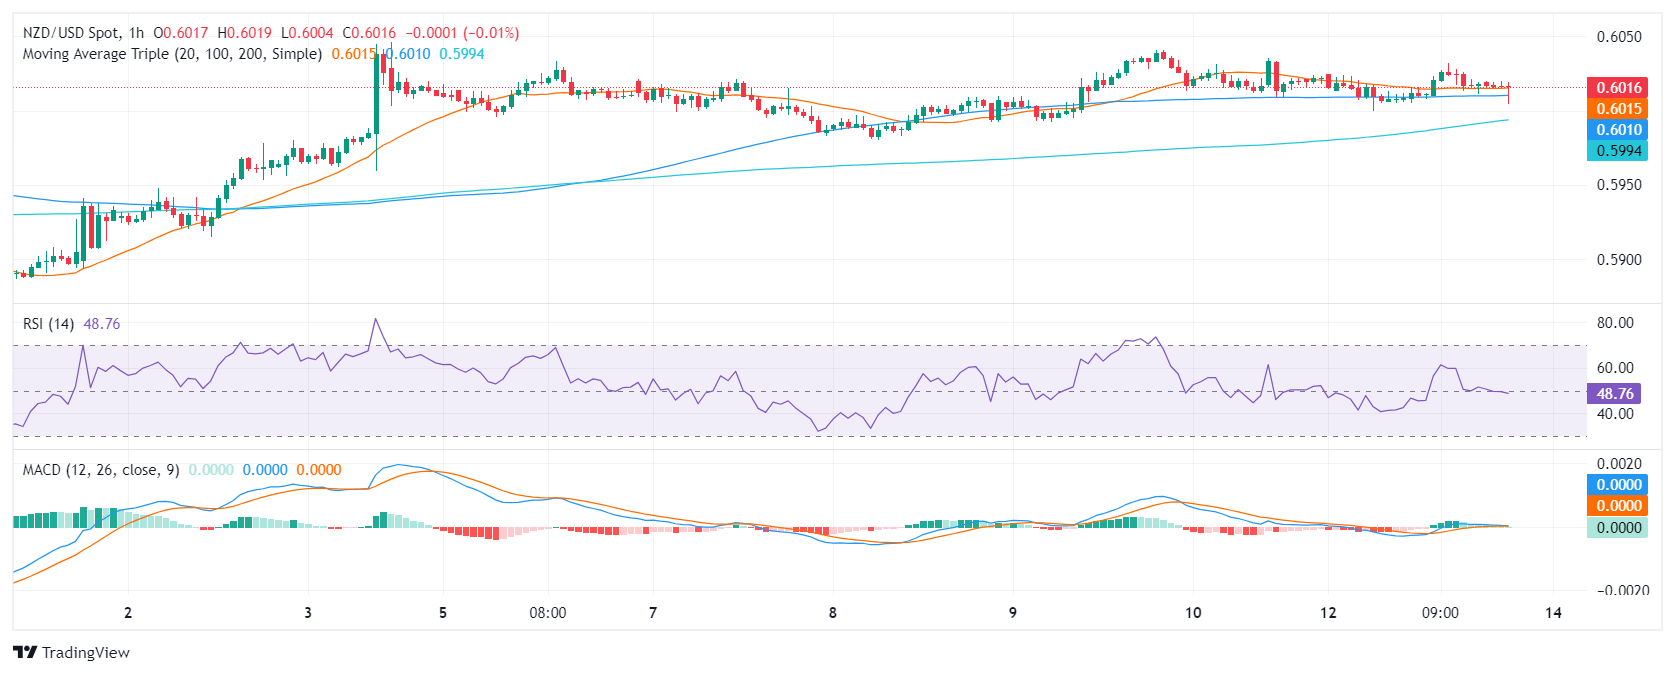
The hourly RSI indicates a slightly negative trend with the latest reading falling towards its middlepoint, showing a slight dominance from the sellers in the market. This is supported by the MACD, which also prints decreasing green bars, further confirming the decrease in buying momentum at an intraday level.

NZD/USD hourly chart

Interpreting the broader perspective, the NZD/USD is positioned below the thresholds of its 100, 200-day Simple Moving Averages (SMA). Significant bearish momentum, implying a prevailing downward trend in both the medium and long term. However, if the buyers defend the 20-day SMA, they may still have some hope to make another stride to reclaim the 200-day SMA.4


NZD/USD

Overview
Today last price 0.6017
Today Daily Change -0.0005
Today Daily Change % -0.08
Today daily open 0.6022
 
Trends
Daily SMA20 0.595
Daily SMA50 0.6011
Daily SMA100 0.6089
Daily SMA200 0.6038
 
Levels
Previous Daily High 0.6041
Previous Daily Low 0.6009
Previous Weekly High 0.6041
Previous Weekly Low 0.598
Previous Monthly High 0.6079
Previous Monthly Low 0.5851
Daily Fibonacci 38.2% 0.6021
Daily Fibonacci 61.8% 0.6029
Daily Pivot Point S1 0.6007
Daily Pivot Point S2 0.5992
Daily Pivot Point S3 0.5975
Daily Pivot Point R1 0.6039
Daily Pivot Point R2 0.6056
Daily Pivot Point R3 0.6071


Disclaimer: For information purposes only. Past performance is not indicative of future results.
placeholder
Financial Markets 2026: Volatility Catalysts in Gold, Silver, Oil, and Blue-Chip Stocks—A CFD Trader's OutlookGet a comprehensive financial market 2026 outlook exploring key economic drivers, volatility catalysts in gold, oil and stocks, and what the evolving economic outlook means for cfd trading strategies and risk management on global markets.
Author  Rachel Weiss
May 15, Fri
Get a comprehensive financial market 2026 outlook exploring key economic drivers, volatility catalysts in gold, oil and stocks, and what the evolving economic outlook means for cfd trading strategies and risk management on global markets.
placeholder
Bitcoin Rallies 4% to Near $70,000 as Market Optimism ReturnsBitcoin price nears $70,000 as market bullish sentiment rebounds.On Thursday (February 26), Bitcoin (BTC) saw a rare strong rally recently, jumping nearly 4% on the day to a high above $6
Author  TradingKey
Feb 26, Thu
Bitcoin price nears $70,000 as market bullish sentiment rebounds.On Thursday (February 26), Bitcoin (BTC) saw a rare strong rally recently, jumping nearly 4% on the day to a high above $6
placeholder
Australian Dollar softens to near 0.7200 as Trump and Xi set for second day of talks The AUD/USD pair attracts some sellers to near 0.7205 during the early Asian trading hours on Friday. Markets remain cautious ahead of the second day meeting between US President Donald Trump and Chinese President Xi Jinping in Beijing on Friday.
Author  FXStreet
May 15, Fri
The AUD/USD pair attracts some sellers to near 0.7205 during the early Asian trading hours on Friday. Markets remain cautious ahead of the second day meeting between US President Donald Trump and Chinese President Xi Jinping in Beijing on Friday.
placeholder
Euro softens to near 1.1600 on US–Iran tensions The EUR/USD pair trades in negative territory around 1.1615 during the early Asian session on Monday. The Euro (EUR) extends the decline as the prolonged US-Iran conflict weighs on the riskier assets.
Author  FXStreet
May 18, Mon
The EUR/USD pair trades in negative territory around 1.1615 during the early Asian session on Monday. The Euro (EUR) extends the decline as the prolonged US-Iran conflict weighs on the riskier assets.
placeholder
Gold declines below $4,500 on stalled US-Iran ceasefire talks, US NFP data loomsGold price (XAU/USD) edges lower to near $4,470 during the early Asian session on Friday. The precious metal remains volatile amid ongoing geopolitical turmoil. Traders will closely monitor the developments surrounding the US-Iran peace deal and the US May employment report later on Friday. 
Author  FXStreet
3 hours ago
Gold price (XAU/USD) edges lower to near $4,470 during the early Asian session on Friday. The precious metal remains volatile amid ongoing geopolitical turmoil. Traders will closely monitor the developments surrounding the US-Iran peace deal and the US May employment report later on Friday. 
Related Instrument
goTop
quote