USD/SEK rises after weak Swedish data

Source Fxstreet
  • The USD/SEK pair commences the week with mild gains around 10.80.
  • Ahead of the Riksbank decision on Wednesday weak Swedish data pressures down the SEK.
  • Markets adjusted their bets on the Fed after the soft NFP report from the US on Friday.

The USD/SEK pair is currently trading with mild gains to begin the week. Despite the optimism from the Federal Reserve's (Fed) projected robust Q2 growth, there are concerns that softer data might impact the USD negatively which may trigger another adjustment of the market's bets on the easing cycle. On the SEK’s side, soft PMIs seem to be applying downward pressure.

On the data front, Sweden's April services and composite PMIs disappointed, with services registering at 48.1 compared to an anticipated 53.8, and a revised figure of 54.1. This decline contributed to a composite PMI of 49.0, down from a revised 53.0 and marked the lowest level since November. As for now, markets anticipate only a 60% chance of a cut this Wednesday from the Riksbank, although a cut becomes fully priced in for June 27.

On the USD side, following the weak job report released on Friday, the likelihood of a July rate cut has surged to 40% from the previous 25%, and the probability of a rate cut in September is near to be price in, after standing at around 55%. The Greenback’s dynamic will be set by the incoming data as Jerome Powell stated that the bank remains data dependent. With no highlights this week, the pair pace will likely be set by the Riksbank’s tone and the market's response to it.

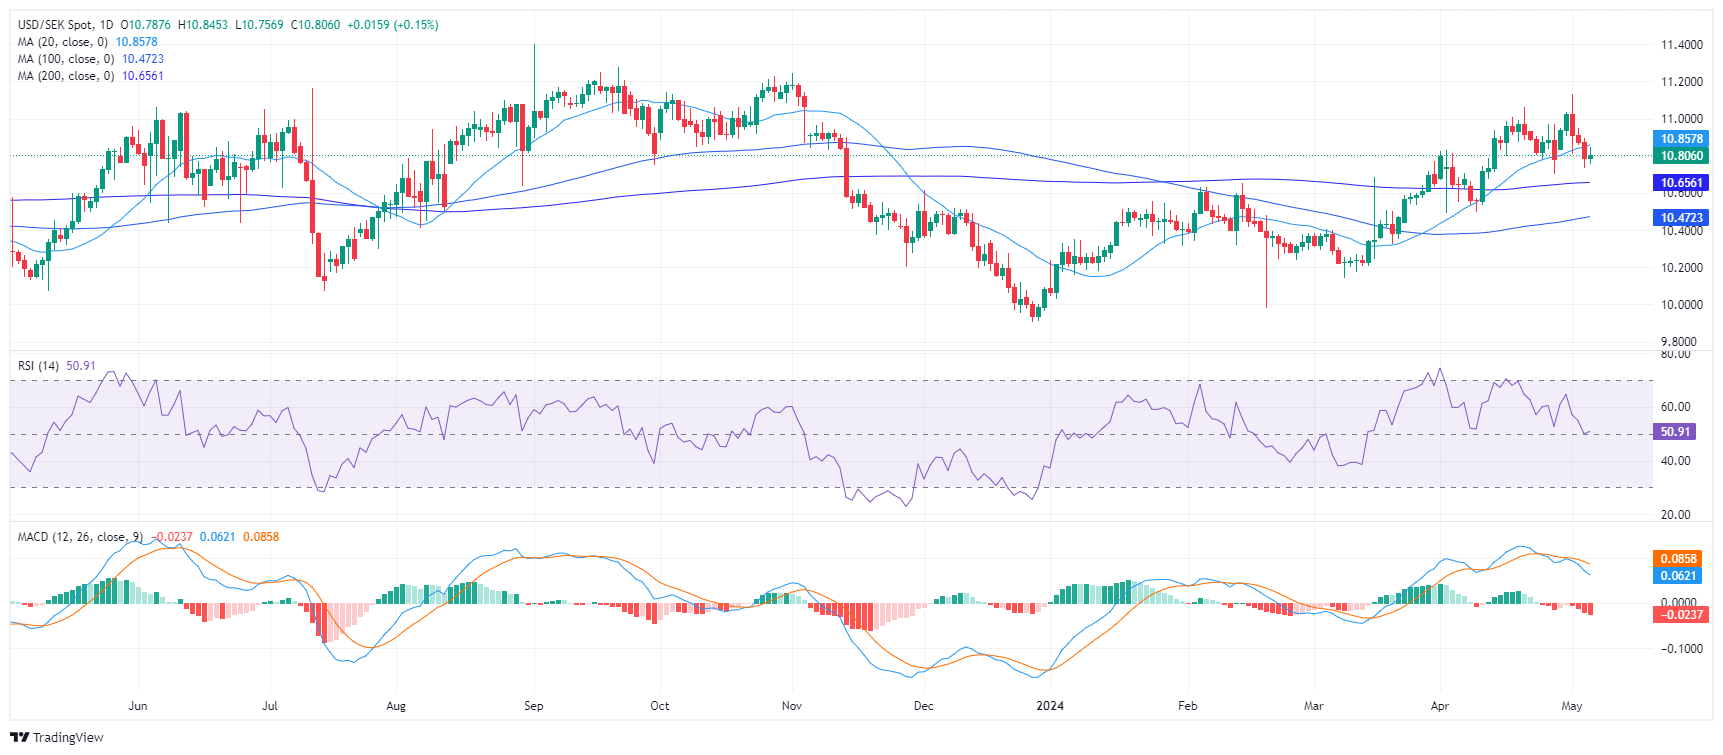
USD/SEK technical analysis

On the daily chart, the Relative Strength Index (RSI) of the USD/SEK pair reveals a transition towards a negative trend falling towards 50. Complementing the RSI effects, the Moving Average Convergence Divergence (MACD) histogram is rising yet printing red bars. This brings to light an increasing negative momentum in the market and a shift of momentum which might start favoring the sellers.

USD/SEK daily chart

USD/SEK

Overview
Today last price 10.8067
Today Daily Change 0.0166
Today Daily Change % 0.15
Today daily open 10.7901
 
Trends
Daily SMA20 10.8454
Daily SMA50 10.6062
Daily SMA100 10.4665
Daily SMA200 10.6548
 
Levels
Previous Daily High 10.8969
Previous Daily Low 10.7346
Previous Weekly High 11.1318
Previous Weekly Low 10.7346
Previous Monthly High 11.0627
Previous Monthly Low 10.4914
Daily Fibonacci 38.2% 10.7966
Daily Fibonacci 61.8% 10.8349
Daily Pivot Point S1 10.7175
Daily Pivot Point S2 10.645
Daily Pivot Point S3 10.5553
Daily Pivot Point R1 10.8798
Daily Pivot Point R2 10.9695
Daily Pivot Point R3 11.0421


Disclaimer: For information purposes only. Past performance is not indicative of future results.
placeholder
Bulls Rout. Bitcoin Slumps Over 16% in a Week to Hit Bottom, Cryptocurrency Market Faces "Serial Liquidations"During the Asian trading session on June 5, Bitcoin extended its recent slump, falling more than 3.5% within 24 hours. It briefly broke below $62,000, hitting a low of $61,100, bringing i
Author  TradingKey
10 hours ago
During the Asian trading session on June 5, Bitcoin extended its recent slump, falling more than 3.5% within 24 hours. It briefly broke below $62,000, hitting a low of $61,100, bringing i
placeholder
Gold declines below $4,500 on stalled US-Iran ceasefire talks, US NFP data loomsGold price (XAU/USD) edges lower to near $4,470 during the early Asian session on Friday. The precious metal remains volatile amid ongoing geopolitical turmoil. Traders will closely monitor the developments surrounding the US-Iran peace deal and the US May employment report later on Friday. 
Author  FXStreet
19 hours ago
Gold price (XAU/USD) edges lower to near $4,470 during the early Asian session on Friday. The precious metal remains volatile amid ongoing geopolitical turmoil. Traders will closely monitor the developments surrounding the US-Iran peace deal and the US May employment report later on Friday. 
placeholder
Bitcoin Suffers Year’s Strongest Waterfall-Style Decline. Will It Next Drop to the $60,000 Mark?During the Asian trading session on June 4, Bitcoin continued its multi-day slump, briefly dropping below the $62,000 mark to $61,338. As of press time, Bitcoin was trading at $63,844, wi
Author  TradingKey
Yesterday 10: 07
During the Asian trading session on June 4, Bitcoin continued its multi-day slump, briefly dropping below the $62,000 mark to $61,338. As of press time, Bitcoin was trading at $63,844, wi
placeholder
Bitcoin drops below $65K amid reinforced bear market signalsBitcoin (BTC) dipped further below $65,000 on Wednesday, with onchain data from Glassnode signaling a market firmly in a bear phase. The decline has pushed prices back into a key valuation range between the Realized Price and the True Market Mean.
Author  FXStreet
Yesterday 01: 32
Bitcoin (BTC) dipped further below $65,000 on Wednesday, with onchain data from Glassnode signaling a market firmly in a bear phase. The decline has pushed prices back into a key valuation range between the Realized Price and the True Market Mean.
placeholder
Forex Today: US Dollar stays resilient ahead of key US dataHere is what you need to know on Wednesday, June 3:
Author  FXStreet
Jun 03, Wed
Here is what you need to know on Wednesday, June 3:
Related Instrument
goTop
quote