

USD/INR steadies as Asian currencies stabilize, RBI intervention eyed
- USD/INR may remain within the range of 90.50-91.00 as Asian currencies stabilize amid persistent risk-off sentiment.
- The Indian Rupee may advance on potential RBI intervention, though hedging and importer demand may limit gains.
- The INR eases as dollar-denominated crude prices remain subdued amid oversupply concerns.
USD/INR steadies on Friday after recording modest losses in the previous session. The pair is likely to trade within the 90.50–91.00 range, as Asian currencies show signs of stabilization while investors remain cautious amid prevailing risk-off sentiment. The Wall Street Journal reported on X that market participants are closely tracking global economic data and geopolitical developments, which could drive regional currency movements.
The Indian Rupee (INR) could draw support against the US Dollar (USD) from potential intervention by the Reserve Bank of India (RBI). However, further upside could be limited by sustained hedging demand from large corporates and routine dollar purchases by importers.
According to Reuters, India’s central bank sold US Dollars aggressively on Thursday to support the Rupee, with six bankers noting that the scale and timing of the intervention surprised most market participants. A major state-owned lender was reportedly among the largest sellers, with one banker describing the Dollar supply as “indiscriminate.”
The Indian Rupee faces reduced pressure as dollar-denominated crude prices stay subdued. West Texas Intermediate (WTI) price trades near $62.80 per barrel at the time of writing. The International Energy Agency (IEA) projects a 3.7 million bpd surplus in 2026 and lowered its global demand forecast, citing the fastest inventory build since 2020.
US Dollar steadies ahead of CPI inflation data
- The US Dollar Index (DXY), which measures the value of the US Dollar against six major currencies, remains in positive territory for the third successive session and is trading near 97.00 at the time of writing.
- The January Consumer Price Index (CPI) report from the United States (US) will be eyed later on Friday. Headline inflation is forecast to ease to 2.5% from 2.7%, while core inflation is expected to slow to 2.5% from 2.6%. A softer print could give the Federal Reserve (Fed) room to resume rate cuts after holding steady at its first meeting of the year.
- Fed Governor Stephan Miran said on Friday that monetary policy has effectively tightened on its own, suggesting there is scope for lower interest rates. Miran added that inflation, once adjusted for distortions, is close to target and that some slack remains in the labor market, leaving room for policy support.
- Markets are currently pricing in two Fed rate cuts in 2026, with the first likely in the second half of the year following stronger-than-expected January employment data. Still, uncertainty persists over potential adjustments to the Fed’s balance sheet ahead of Kevin Warsh’s anticipated appointment as Chair in May. Warsh has previously criticized asset purchases but recently signaled he may support coordination with the Treasury to help lower yields.
- The CME FedWatch tool suggests that financial markets are now pricing in nearly a 91% probability that the Fed will leave rates unchanged at its March meeting, up from 77% the previous week.
- The US Bureau of Labor Statistics (BLS) reported on Wednesday that Nonfarm Payrolls (NFP) increased by 130,000 in January, following a revised 48,000 gain in December (previously 50,000), and surpassed market expectations of 70,000. Meanwhile, the Unemployment Rate edged down to 4.3% from 4.4%.
- US inflation expectations eased, with median one-year-ahead inflation expectations falling to 3.1% in January, the lowest in six months, from 3.4% in December. Food price expectations were unchanged at 5.7%, while three- and five-year expectations remained steady at 3%.
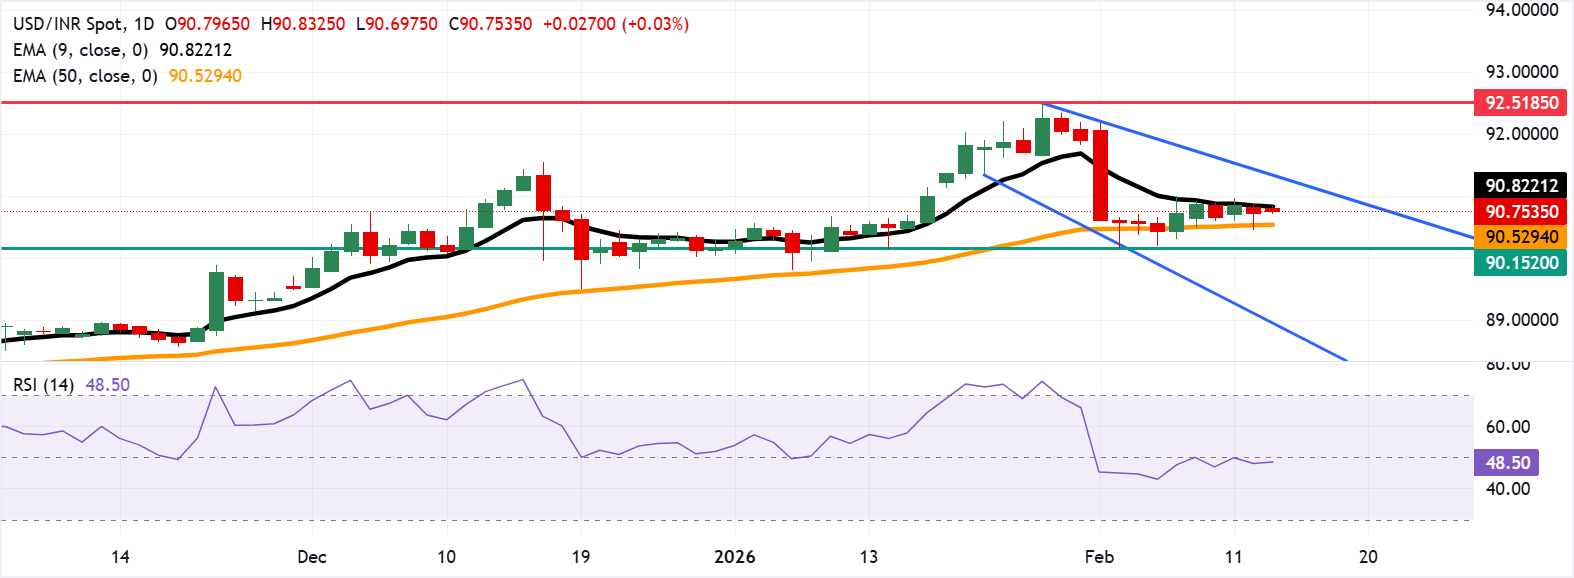
USD/INR remains below nine-day EMA near 91.00
USD/INR is trading around 90.70 at the time of writing. Daily chart analysis suggests a prevailing bearish bias, with the pair moving within a descending channel. The pair sits below the nine-day Exponential Moving Average (EMA) but above the 50-day EMA, framing a shallow pullback within a broader upward bias. The 50-day EMA continues to rise, while the nine-day EMA eases, indicating near-term headwinds but an intact medium-term underpinning. The 14-day Relative Strength Index (RSI) at 48.72 is neutral and edging toward 50, hinting at stabilizing momentum.
Initial support is seen at the 50-day EMA at 90.52, with the four-week low of 90.15 below that. A clear break under this zone may dampen medium-term momentum and expose the channel’s lower boundary near 89.00. On the upside, immediate resistance appears at the nine-day EMA around 90.81. A sustained advance could aim for the channel’s upper limit near 91.40, ahead of the January 28 record high of 92.51.
(The technical analysis of this story was written with the help of an AI tool.)
US Dollar Price Today
The table below shows the percentage change of US Dollar (USD) against listed major currencies today. US Dollar was the strongest against the Japanese Yen.
| USD | EUR | GBP | JPY | CAD | AUD | NZD | INR | |
|---|---|---|---|---|---|---|---|---|
| USD | 0.01% | 0.04% | 0.21% | 0.00% | 0.06% | -0.01% | 0.08% | |
| EUR | -0.01% | 0.02% | 0.22% | -0.00% | 0.05% | -0.05% | -0.03% | |
| GBP | -0.04% | -0.02% | 0.17% | -0.03% | 0.02% | -0.07% | 0.04% | |
| JPY | -0.21% | -0.22% | -0.17% | -0.18% | -0.15% | -0.24% | -0.23% | |
| CAD | -0.01% | 0.00% | 0.03% | 0.18% | 0.03% | -0.06% | -0.04% | |
| AUD | -0.06% | -0.05% | -0.02% | 0.15% | -0.03% | -0.10% | -0.08% | |
| NZD | 0.00% | 0.05% | 0.07% | 0.24% | 0.06% | 0.10% | 0.13% | |
| INR | -0.08% | 0.03% | -0.04% | 0.23% | 0.04% | 0.08% | -0.13% |
The heat map shows percentage changes of major currencies against each other. The base currency is picked from the left column, while the quote currency is picked from the top row. For example, if you pick the US Dollar from the left column and move along the horizontal line to the Japanese Yen, the percentage change displayed in the box will represent USD (base)/JPY (quote).
Indian Rupee FAQs
The Indian Rupee (INR) is one of the most sensitive currencies to external factors. The price of Crude Oil (the country is highly dependent on imported Oil), the value of the US Dollar – most trade is conducted in USD – and the level of foreign investment, are all influential. Direct intervention by the Reserve Bank of India (RBI) in FX markets to keep the exchange rate stable, as well as the level of interest rates set by the RBI, are further major influencing factors on the Rupee.
The Reserve Bank of India (RBI) actively intervenes in forex markets to maintain a stable exchange rate, to help facilitate trade. In addition, the RBI tries to maintain the inflation rate at its 4% target by adjusting interest rates. Higher interest rates usually strengthen the Rupee. This is due to the role of the ‘carry trade’ in which investors borrow in countries with lower interest rates so as to place their money in countries’ offering relatively higher interest rates and profit from the difference.
Macroeconomic factors that influence the value of the Rupee include inflation, interest rates, the economic growth rate (GDP), the balance of trade, and inflows from foreign investment. A higher growth rate can lead to more overseas investment, pushing up demand for the Rupee. A less negative balance of trade will eventually lead to a stronger Rupee. Higher interest rates, especially real rates (interest rates less inflation) are also positive for the Rupee. A risk-on environment can lead to greater inflows of Foreign Direct and Indirect Investment (FDI and FII), which also benefit the Rupee.
Higher inflation, particularly, if it is comparatively higher than India’s peers, is generally negative for the currency as it reflects devaluation through oversupply. Inflation also increases the cost of exports, leading to more Rupees being sold to purchase foreign imports, which is Rupee-negative. At the same time, higher inflation usually leads to the Reserve Bank of India (RBI) raising interest rates and this can be positive for the Rupee, due to increased demand from international investors. The opposite effect is true of lower inflation.
Recommended Articles


