

AUD/JPY hovers around five-month highs ahead of BoJ's policy decision
- AUD/JPY extends its winning streak after the lower-than-expected Tokyo CPI data released on Friday.
- The Australian 10-year Government Bond Yield has reached a 21-week high of 4.59%.
- Tokyo CPI has fallen below the Bank of Japan's (BoJ) 2% target for the second time this year.
AUD/JPY extends its winning streak for the fifth consecutive session on Friday. The Australian Dollar (AUD) finds support from increasing bids for a hawkish stance for the Reserve Bank of Australia’s (RBA) monetary policy. The revision by TD Securities indicates a delay in the expected rate cut by the Reserve Bank of Australia (RBA) until February 2025 instead of November. This boosts the Australian Dollar (AUD) and consequently supports the AUD/JPY cross.
Australia’s Consumer Price Index (CPI) data on Wednesday, surpassing expectations, is also playing a role in an increase in Australian government bond yields as traders price out expectations regarding interest rate cuts by the RBA in 2024. The Australian 10-year Government Bond Yield has reached a 21-week high of 4.59%, indicating a significant upward trend.
The Japanese Yen (JPY) depreciated following the release of Japan's Tokyo Consumer Price Index (CPI), which came in well below expectations early Friday. This print marks the second time this year that inflation has fallen below the Bank of Japan's (BoJ) 2% target, reducing pressure on the central bank to raise interest rates again. As a result, market sentiment is shifting towards the expectation that the BoJ will abstain from implementing rate hikes during its meeting on Friday.
Daily Digest Market Movers: AUD/JPY gains ground after weaker Tokyo’s CPI data
- Tokyo Consumer Price Index rose 1.8% YoY in April, well below the previous print of 2.6%. Markets were broadly expecting Tokyo inflation to hold steady over the period. The Core CPI fell sharply to 1.6% year-on-year, marking its lowest level since March 2022 and falling well below forecasts of 2.2%.
- SocGen's assessment of the potential for USD/JPY to test the Japanese Ministry of Finance's intervention limits due to persistent US rate expectations and recent market dynamics suggests a significant focus on the interplay between US economic data and currency movements.
- On Friday, a report from Reuters said that the Bank of Japan (BOJ) is expected to project that inflation will remain close to its 2% target in the coming years and signal its preparedness to raise interest rates from their near-zero levels. This stance by the BOJ is aimed at preventing yen depreciation and discouraging market participants from pushing the currency to fresh 34-year lows.
- Jiji news agency reported on Thursday that the Bank of Japan (BOJ) might reduce its bond purchases appears to be exerting a more significant influence on the market sentiment compared to the lower-than-expected Tokyo Consumer Price Index (CPI) data released today.
- According to Luci Ellis, Westpac's chief economist and former Assistant Governor (Economic) at the Reserve Bank of Australia, inflation slightly surpassed expectations in the March quarter. They anticipate the Board will maintain interest rates in May and have revised the projected date for the initial rate reduction from September to November this year.
- According to analysts at Barrenjoey Capital Partners, a leading Australian investment banking firm, advised to utilize the trimmed mean to rank Australia's inflation. Australia's six-month annualized rate of trimmed mean inflation, standing at 3.6%, is notably the highest worldwide, surpassing even the United States' 3.2% six-month annualized rate of trimmed mean inflation.
- Australia’s Consumer Price Index (CPI) rose by 1.0% QoQ in the first quarter of 2024, against the expected 0.8% and 0.6% prior. CPI (YoY) increased by 3.6% compared to the forecast of 3.4% for Q1 and 4.1% prior. Australia’s Monthly Consumer Price Index (YoY) rose by 3.5% in March, against the market expectations and the previous reading of 3.4%.
- According to the Japan Times, the proportion of Japanese companies intending to increase their pay scales reached 70.7%, marking a rise of 6.3 percentage points from the previous year. Additionally, the number of companies planning to implement pay-scale hikes and regular pay increases totaling 5% or more amounted to 36.5%, nearly doubling from the previous year. This could provide support for the Yen.
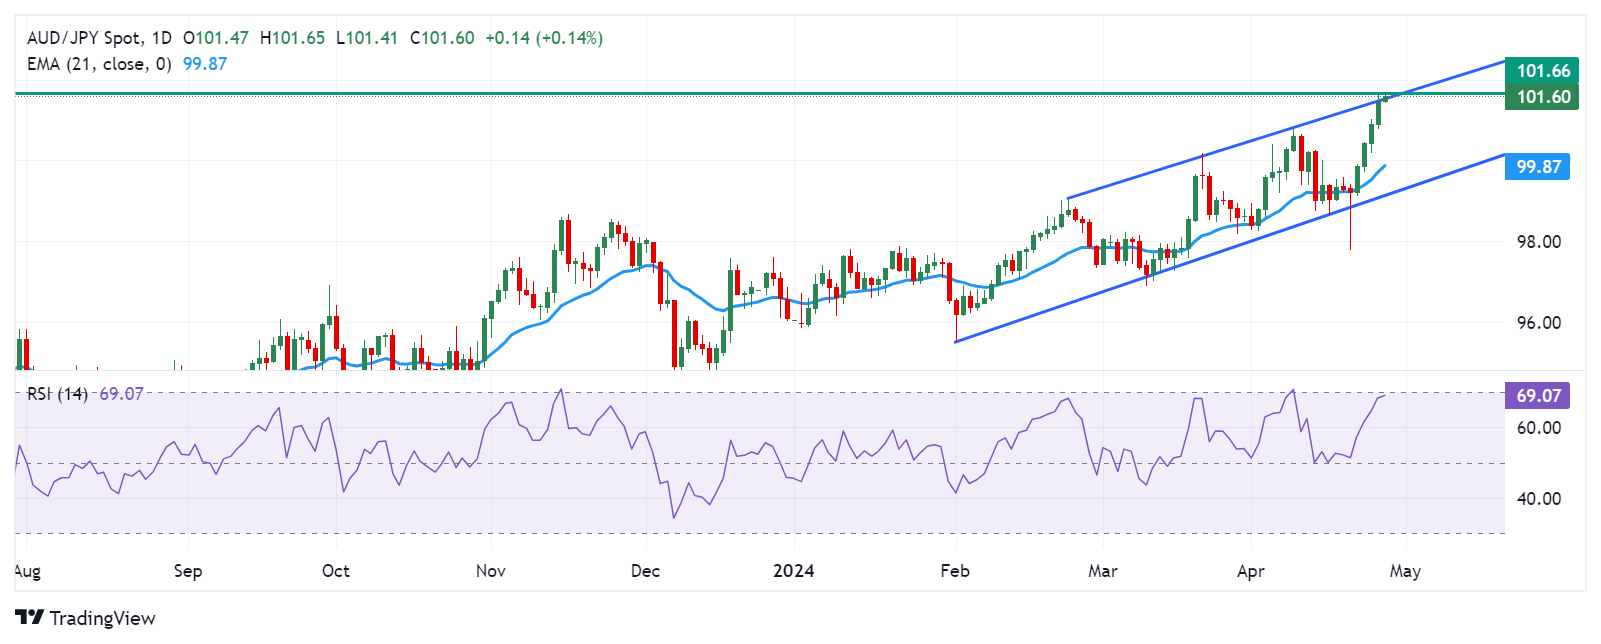
Technical Analysis: AUD/JPY hovers around the major level of 101.50
The AUD/JPY trades around 101.50 on Friday, testing the upper boundary of the daily ascending channel, trading around a fresh five-month high of 101.66. Additionally, the 14-day Relative Strength Index (RSI) is trending above the 50-level, strengthening the bullish sentiment. The immediate resistance is seen at the psychological level of 102.00.
On the downside, immediate support for the AUD/JPY pair could be found at the psychological level of 101.00. If the pair breaches below this level, it suggests a bearish sentiment may prevail and might lead the AUD/JPY cross to a further decline toward the psychological level of 100.00, followed by the 21-day Exponential Moving Average (EMA) at the level of 99.87. Further depreciation will likely test the lower boundary of the ascending channel around the level of 99.00.
AUD/JPY: Daily Chart
Australian Dollar price today
The table below shows the percentage change of the Australian Dollar (AUD) against listed major currencies today. The Australian Dollar was the strongest against the Swiss Franc.
| USD | EUR | GBP | CAD | AUD | JPY | NZD | CHF | |
| USD | 0.00% | 0.02% | -0.04% | -0.10% | 0.01% | -0.13% | 0.05% | |
| EUR | 0.00% | 0.01% | -0.02% | -0.10% | 0.00% | -0.13% | 0.05% | |
| GBP | -0.01% | -0.02% | -0.04% | -0.12% | 0.00% | -0.17% | 0.04% | |
| CAD | 0.03% | 0.03% | 0.03% | -0.08% | 0.03% | -0.13% | 0.06% | |
| AUD | 0.10% | 0.10% | 0.12% | 0.08% | 0.11% | -0.05% | 0.16% | |
| JPY | -0.01% | -0.01% | -0.01% | -0.04% | -0.12% | -0.15% | 0.04% | |
| NZD | 0.13% | 0.15% | 0.16% | 0.12% | 0.04% | 0.16% | 0.21% | |
| CHF | -0.06% | -0.06% | -0.03% | -0.09% | -0.15% | -0.05% | -0.19% |
The heat map shows percentage changes of major currencies against each other. The base currency is picked from the left column, while the quote currency is picked from the top row. For example, if you pick the Euro from the left column and move along the horizontal line to the Japanese Yen, the percentage change displayed in the box will represent EUR (base)/JPY (quote).
Australian Dollar FAQs
One of the most significant factors for the Australian Dollar (AUD) is the level of interest rates set by the Reserve Bank of Australia (RBA). Because Australia is a resource-rich country another key driver is the price of its biggest export, Iron Ore. The health of the Chinese economy, its largest trading partner, is a factor, as well as inflation in Australia, its growth rate and Trade Balance. Market sentiment – whether investors are taking on more risky assets (risk-on) or seeking safe-havens (risk-off) – is also a factor, with risk-on positive for AUD.
The Reserve Bank of Australia (RBA) influences the Australian Dollar (AUD) by setting the level of interest rates that Australian banks can lend to each other. This influences the level of interest rates in the economy as a whole. The main goal of the RBA is to maintain a stable inflation rate of 2-3% by adjusting interest rates up or down. Relatively high interest rates compared to other major central banks support the AUD, and the opposite for relatively low. The RBA can also use quantitative easing and tightening to influence credit conditions, with the former AUD-negative and the latter AUD-positive.
China is Australia’s largest trading partner so the health of the Chinese economy is a major influence on the value of the Australian Dollar (AUD). When the Chinese economy is doing well it purchases more raw materials, goods and services from Australia, lifting demand for the AUD, and pushing up its value. The opposite is the case when the Chinese economy is not growing as fast as expected. Positive or negative surprises in Chinese growth data, therefore, often have a direct impact on the Australian Dollar and its pairs.
Iron Ore is Australia’s largest export, accounting for $118 billion a year according to data from 2021, with China as its primary destination. The price of Iron Ore, therefore, can be a driver of the Australian Dollar. Generally, if the price of Iron Ore rises, AUD also goes up, as aggregate demand for the currency increases. The opposite is the case if the price of Iron Ore falls. Higher Iron Ore prices also tend to result in a greater likelihood of a positive Trade Balance for Australia, which is also positive of the AUD.
The Trade Balance, which is the difference between what a country earns from its exports versus what it pays for its imports, is another factor that can influence the value of the Australian Dollar. If Australia produces highly sought after exports, then its currency will gain in value purely from the surplus demand created from foreign buyers seeking to purchase its exports versus what it spends to purchase imports. Therefore, a positive net Trade Balance strengthens the AUD, with the opposite effect if the Trade Balance is negative.
Recommended Articles


