GBP/USD Price Analysis: Extends recovery above 1.2500, but bears loom around 200-DMA

Source Fxstreet
  • GBP/USD gains over 0.40%, rebounding from daily lows after US Q1 economic growth underperforms expectations.
  • Mixed signals from the US economy support Sterling's rise.
  • Technical outlook: Key resistance at 1.2559 with potential to target April 9 high at 1.2709 if upward momentum continues.

The Pound Sterling resumed its advance against the US Dollar, climbing more than 0.40% and trading at 1.2518. During the day, the GBP/USD bounced off daily lows of 1.2450 following the release of mixed economic data from the United States. The US economy in Q1 2024 grew below estimates, which would warrant easing monetary policy. But prices edging up spurred investors' reaction to priced-out rate cuts in 2024.

GBP/USD Price Analysis: Technical outlook

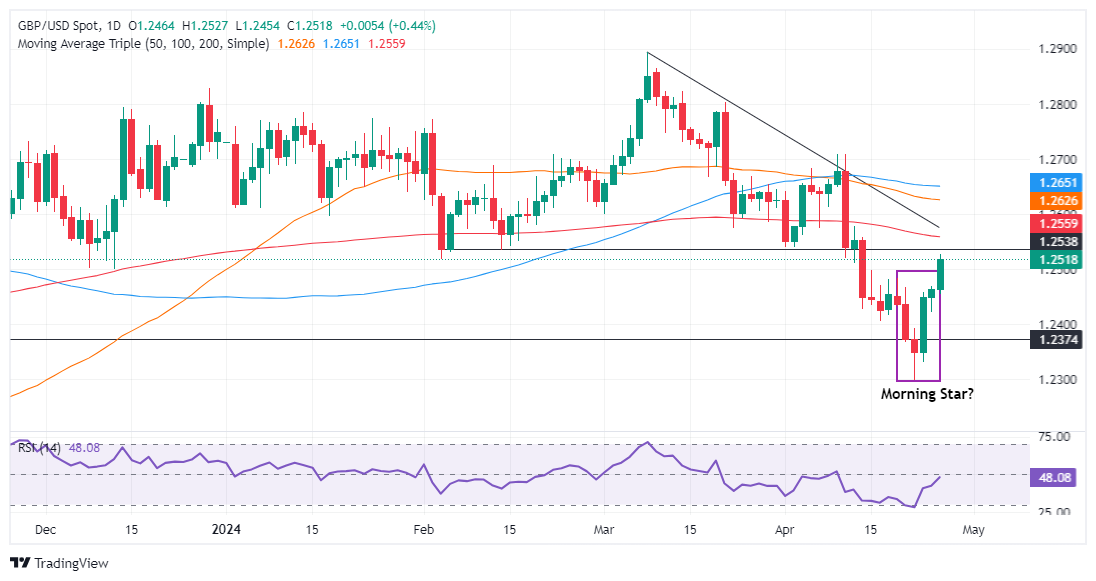
The GBP/USD is aiming up sharply, though it remains bearishly biased. Although the major remains far from the latest cycle high, if buyers regain some key resistance levels, that would ultimately expose the April 9 high at 1.2709, the latest cycle high.

Therefore, the GBP/USD first resistance would be the 200-day moving average (DMA) at 1.2559. A breach of the latter will expose the 1.2600 figure, followed by the 50 and 100-DMAs, each a 1.2624 and 1.2647. Once those levels are surpassed, the April 9 high would be up next.

On the other hand, if GBP/USD slumps below 1.2500, that would keep the downtrend intact and pave the way to re-test the year-to-date (YTD) low of 1.2299.

GBP/USD Price Action – Daily Chart
GBP/USD

Overview
Today last price 1.2521
Today Daily Change 0.0057
Today Daily Change % 0.46
Today daily open 1.2464
 
Trends
Daily SMA20 1.2529
Daily SMA50 1.2627
Daily SMA100 1.2651
Daily SMA200 1.256
 
Levels
Previous Daily High 1.247
Previous Daily Low 1.2423
Previous Weekly High 1.2499
Previous Weekly Low 1.2367
Previous Monthly High 1.2894
Previous Monthly Low 1.2575
Daily Fibonacci 38.2% 1.2452
Daily Fibonacci 61.8% 1.2441
Daily Pivot Point S1 1.2434
Daily Pivot Point S2 1.2405
Daily Pivot Point S3 1.2387
Daily Pivot Point R1 1.2482
Daily Pivot Point R2 1.2499
Daily Pivot Point R3 1.2529


Disclaimer: For information purposes only. Past performance is not indicative of future results.
placeholder
Gold Price Forecast: XAU/USD declines below $4,050 on USD strength and hawkish Fed comments Gold price (XAU/USD) extends the decline to around $4,030 during the early Asian session on Tuesday. The precious metal edges lower as traders dialed back expectations of a US interest rate cut next month.
Author  FXStreet
Nov 18, Tue
Gold price (XAU/USD) extends the decline to around $4,030 during the early Asian session on Tuesday. The precious metal edges lower as traders dialed back expectations of a US interest rate cut next month.
placeholder
Ethereum Edges Toward Long-Term Holders’ Cost Basis, Now Only 8% Above Key Accumulation LevelEthereum is trading near $3,150 and just 8% above a key $2,895 long-term holders’ cost basis, with on-chain flows, macro uncertainty and support around $3,000–$2,800 all shaping what comes next for ETH.
Author  Mitrade
Nov 18, Tue
Ethereum is trading near $3,150 and just 8% above a key $2,895 long-term holders’ cost basis, with on-chain flows, macro uncertainty and support around $3,000–$2,800 all shaping what comes next for ETH.
placeholder
Top 3 Price Prediction: Bitcoin, Ethereum, Ripple – BTC, ETH and XRP Look for a Foothold After a Sharp ShakeoutBitcoin trades near $92,600 after a dip below $90,000, while Ethereum around $3,118 and XRP near $2.21–$2.23 sit on key support zones, as BTC, ETH and XRP all try to turn a sharp correction into a tradable rebound rather than a deeper slide.
Author  Mitrade
Nov 19, Wed
Bitcoin trades near $92,600 after a dip below $90,000, while Ethereum around $3,118 and XRP near $2.21–$2.23 sit on key support zones, as BTC, ETH and XRP all try to turn a sharp correction into a tradable rebound rather than a deeper slide.
placeholder
Bitcoin's Drop to $86K Approaches 'Max Pain' Zone, Yet Presents Potential Buying OpportunityAnalysts identify the $84,000 to $73,000 range as Bitcoin's likely "max pain" territory where capitulation may occur.
Author  Mitrade
Yesterday 03: 35
Analysts identify the $84,000 to $73,000 range as Bitcoin's likely "max pain" territory where capitulation may occur.
placeholder
Market Meltdown: BTC, ETH, and XRP Capitulate as Bears Seize ControlBitcoin trades around $85,900 after breaking below $86,000, with Ethereum under $2,791 and XRP below $1.99 as BTC, ETH and XRP extend weekly losses of 8–10%, forcing traders to focus on supports at $85,000, $2,749 and $1.77 for clues on whether this sell-off has further to run.
Author  Mitrade
Yesterday 04: 15
Bitcoin trades around $85,900 after breaking below $86,000, with Ethereum under $2,791 and XRP below $1.99 as BTC, ETH and XRP extend weekly losses of 8–10%, forcing traders to focus on supports at $85,000, $2,749 and $1.77 for clues on whether this sell-off has further to run.
goTop
quote