CFDs are complex instruments and come with a high risk of losing money rapidly due to leverage. You should consider whether you understand how CFDs work and whether you can afford to take the high risk of losing your money.
    Mitrade Insights is dedicated to providing investors with rich, timely and most valuable financial information to help investors grasp the market situation and find timely trading opportunities.
    2021
    Best News & Analysis Provider
    FxDailyInfo
    2022
    Best Forex Educational Resources Global
    International Business Magazine

    AUD/JPY Price Analysis: Bullish momentum persists, downward correction likely

    Source Fxstreet
    Apr 25, 2024 18:09
    • The daily RSI for AUD/JPY reveals that the bulls are in charge, approaching overbought conditions.
    • Despite the hourly MACD indicating a short-term dip, the RSI highlights the buyers'  dominance.
    • As the cross jumped to multi-year highs, the buyers might eventually run out of gas.

    The AUD/JPY exhibits substantial bullish momentum, standing at the 101.39 level and showing an encouraging 0.54% rally. The dominance of bullish trends is evident but a healthy correction might be necessary for the buyers to conquer additional ground.

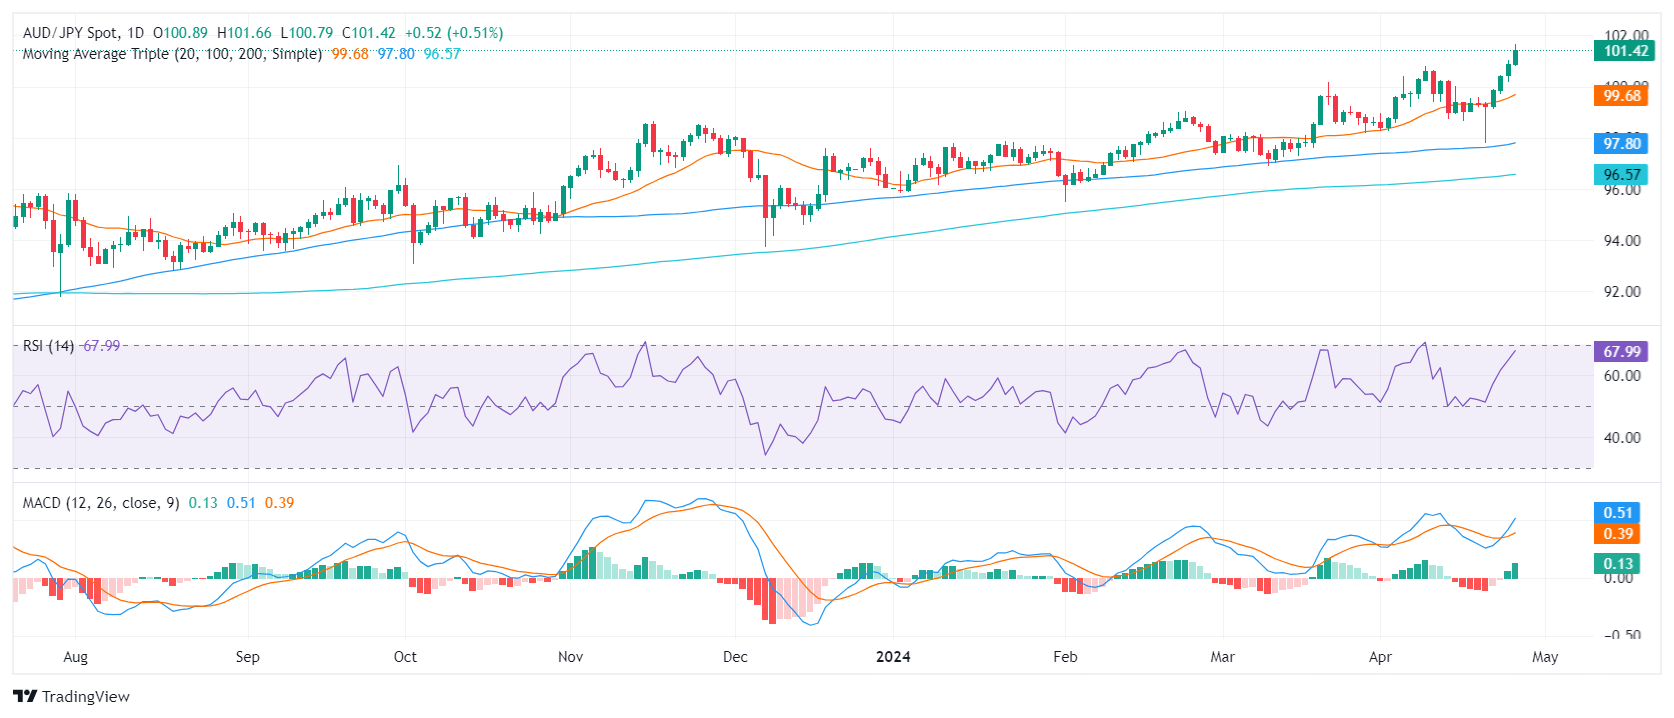
    On the daily chart, the Relative Strength Index (RSI) reveals a positive momentum, with the latest reading nearing the overbought condition. The Moving Average Convergence Divergence (MACD) supports this, printing green bars.

    AUD/JPY daily chart
    Shifting the attention to the hourly chart, the MACD paints a different picture with its red bars, signaling that in this timeframe, buyers might have already become exhausted. However, the RSI readings suggest steady, positive momentum with figures hovering above 50, apart from a brief dip to 48.

    AUD/JPY hourly chart
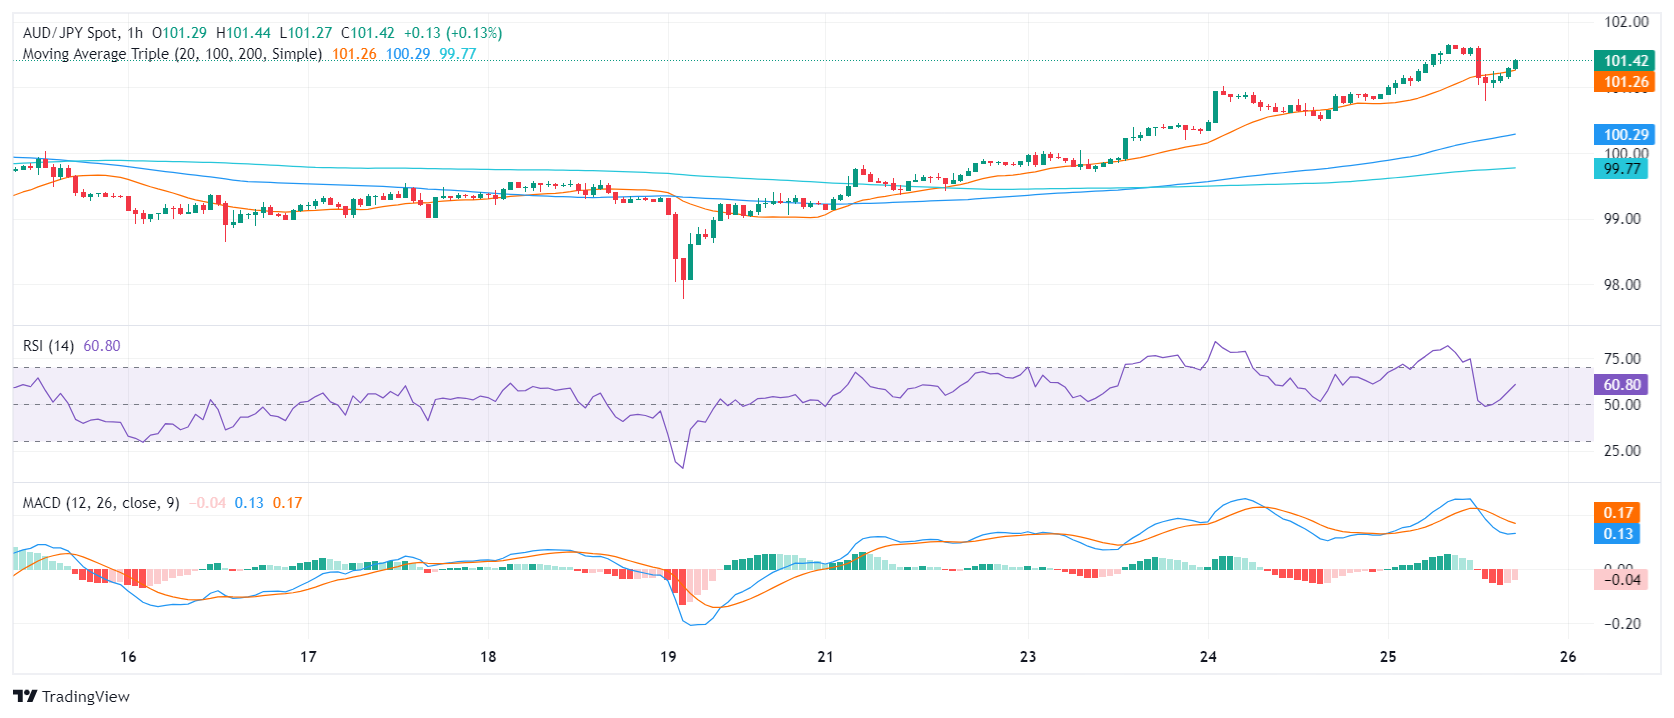
    The AUD/JPY also demonstrates a bullish stance in the broader picture as it positions itself above the 20, 100, and 200-day Simple Moving Averages (SMA). So all signals points to a clear bullish stance, but traders should be alert that if daily indicators reach overbought conditions, the pair may see some healthy downside to consolidate gains.


    AUD/JPY

    Overview
    Today last price 101.4
    Today Daily Change 0.50
    Today Daily Change % 0.50
    Today daily open 100.9
     
    Trends
    Daily SMA20 99.54
    Daily SMA50 98.75
    Daily SMA100 97.73
    Daily SMA200 96.54
     
    Levels
    Previous Daily High 101.02
    Previous Daily Low 100.19
    Previous Weekly High 100.02
    Previous Weekly Low 97.78
    Previous Monthly High 100.17
    Previous Monthly Low 96.9
    Daily Fibonacci 38.2% 100.7
    Daily Fibonacci 61.8% 100.51
    Daily Pivot Point S1 100.39
    Daily Pivot Point S2 99.87
    Daily Pivot Point S3 99.56
    Daily Pivot Point R1 101.21
    Daily Pivot Point R2 101.53
    Daily Pivot Point R3 102.04


    Disclaimer: For information purposes only. Past performance is not indicative of future results.
    placeholder
    Australian Dollar gains ground on hawkish RBA, Nonfarm Payrolls awaitedThe Australian Dollar (AUD) continues its winning streak for the third successive session on Friday.
    Source  Fxstreet
    The Australian Dollar (AUD) continues its winning streak for the third successive session on Friday.
    placeholder
    EUR/USD loses momentum as upside remains capped on firm ECB rate cut betsEUR/USD is stuck in a tight range above the round-level support of 1.0700 in Thursday’s European session.
    Source  Fxstreet
    EUR/USD is stuck in a tight range above the round-level support of 1.0700 in Thursday’s European session.
    placeholder
    EUR/JPY Price Analysis: Bulls maintain control, bears are not done yet and appear to gear upThe EUR/JPY pair stands at 168.11 under strong bull control, reflecting a steady uptrend with a 0.38% gain on Tuesday.
    Source  Fxstreet
    The EUR/JPY pair stands at 168.11 under strong bull control, reflecting a steady uptrend with a 0.38% gain on Tuesday.
    goTop
    quote