

Canadian Dollar spreads on Thursday after mixed US data flummoxes markets
- Canadian Dollar trapped near familiar levels, gives mixed performance.
- Canada absent from the economic calendar until next week’s GDP.
- US GDP comes in soft, but PCE hints at still high inflation.
The Canadian Dollar (CAD) spread on Thursday, giving a mixed performance and sticking close to familiar technical levels after US data printed in both directions early in the US market session. US Gross Domestic Product (GDP) eased more than expected, a boon for investors looking for rate cuts from the US Federal Reserve (Fed). However, inflation continues to be a major sticking point for rate cut hopes after US Personal Consumption Expenditure (PCE) inflation climbed even higher than expected.
Canada is absent from the economic calendar for the remainder of the trading week. The next piece of useful Canadian economic data will be next Tuesday’s Canadian MoM GDP for February. Canada’s S&P Global Manufacturing Purchasing Managers Index (PMI) will also print next Wednesday.
Daily digest market movers: Canadian Dollar lacks momentum after US data fails to deliver clean picture
- Annualized US GDP for the first quarter eased to 1.6%, declining from the previous 3.4% and falling well short of the forecast of 2.5%.
- Read more: US GDP expands less that expected in Q1
- Rapidly slowing GDP is a welcome boon for investors desperate for rate cuts from Fed. However, US PCE inflation in Q1 rose to 3.7%, vaulting over forecast of 3.4% and accelerating from previous 2.0%.
- Rising inflation will keep Fed hobbled on rate cuts, markets churn on mixed print.
- Friday’s US PCE Price Index will draw additional attention after Thursday’s gloomy bellwether.
- March’s MoM US PCE Price Index is expected to hold steady at 0.3%, while the YoY figure is expected to tick down to 2.6% from 2.8%.
Canadian Dollar price today
The table below shows the percentage change of Canadian Dollar (CAD) against listed major currencies today. Canadian Dollar was the strongest against the Japanese Yen.
| USD | EUR | GBP | CAD | AUD | JPY | NZD | CHF | |
| USD | -0.15% | -0.24% | -0.06% | -0.10% | 0.22% | 0.00% | -0.04% | |
| EUR | 0.17% | -0.05% | 0.11% | 0.07% | 0.39% | 0.16% | 0.13% | |
| GBP | 0.23% | 0.08% | 0.17% | 0.15% | 0.47% | 0.21% | 0.20% | |
| CAD | 0.11% | -0.06% | -0.13% | -0.01% | 0.30% | 0.09% | 0.05% | |
| AUD | 0.10% | -0.05% | -0.12% | 0.04% | 0.31% | 0.09% | 0.06% | |
| JPY | -0.21% | -0.35% | -0.44% | -0.28% | -0.31% | -0.22% | -0.26% | |
| NZD | 0.04% | -0.12% | -0.20% | -0.04% | -0.07% | 0.25% | 0.02% | |
| CHF | 0.04% | -0.12% | -0.20% | -0.04% | -0.05% | 0.28% | 0.01% |
The heat map shows percentage changes of major currencies against each other. The base currency is picked from the left column, while the quote currency is picked from the top row. For example, if you pick the Euro from the left column and move along the horizontal line to the Japanese Yen, the percentage change displayed in the box will represent EUR (base)/JPY (quote).
Technical analysis: Canadian Dollar trades steady but mixed
The Canadian Dollar (CAD) is getting pushed into the middle on Thursday, trading flat to within a quarter of a percent across the major currency board during the US market session. The CAD sees a meager tenth of a percent gain against the US Dollar (USD). The Japanese Yen (JPY) is down a quarter of a percent against the Canadian Dollar as the market’s worst-performing currency on the day.
The CAD continues to trade within a tight range near the 1.3700 handle against the US Dollar, and the USD/CAD has priced in a near-term price floor near 1.3660. A topside break is hampered by the 200-hour Exponential Moving Average (EMA) at 1.3710, and a heavy supply zone rests just below current price action below 1.3600.
USD/CAD hourly chart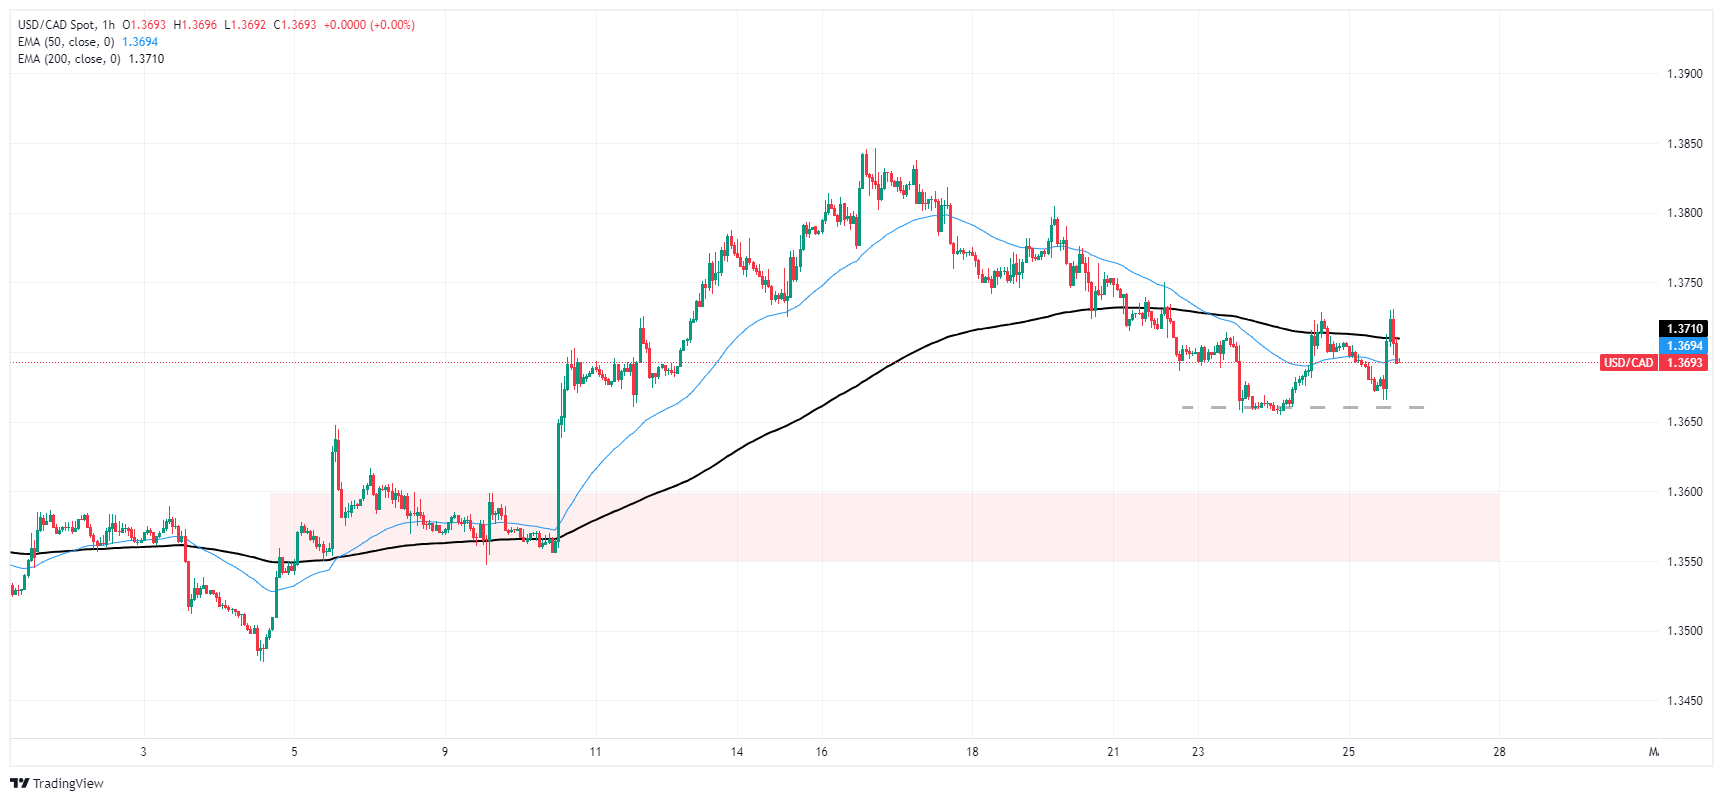
USD/CAD daily chart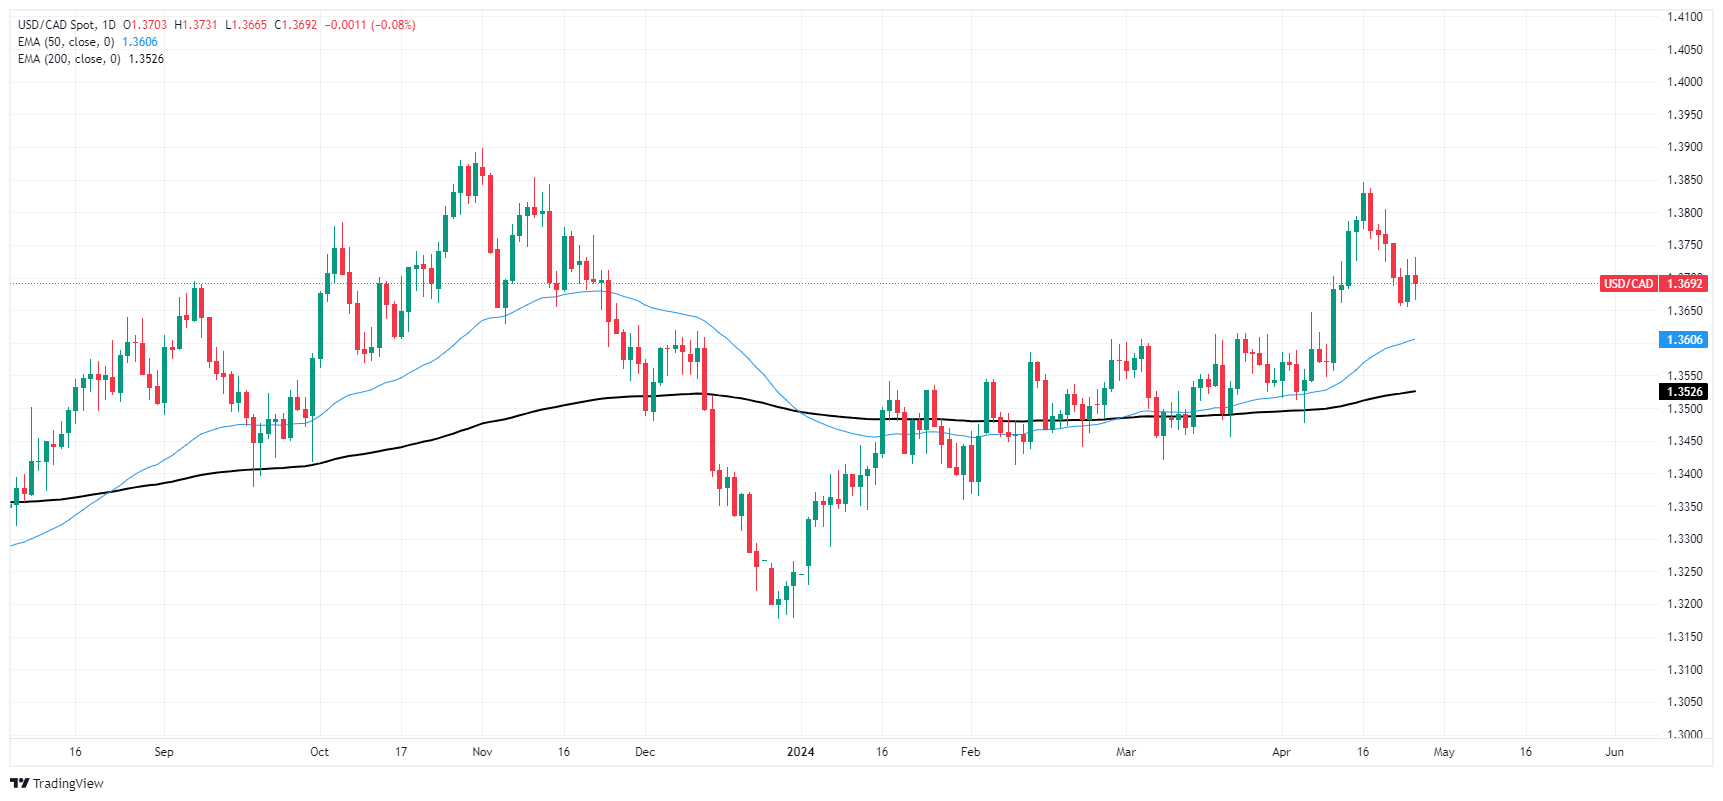
Canadian Dollar FAQs
The key factors driving the Canadian Dollar (CAD) are the level of interest rates set by the Bank of Canada (BoC), the price of Oil, Canada’s largest export, the health of its economy, inflation and the Trade Balance, which is the difference between the value of Canada’s exports versus its imports. Other factors include market sentiment – whether investors are taking on more risky assets (risk-on) or seeking safe-havens (risk-off) – with risk-on being CAD-positive. As its largest trading partner, the health of the US economy is also a key factor influencing the Canadian Dollar.
The Bank of Canada (BoC) has a significant influence on the Canadian Dollar by setting the level of interest rates that banks can lend to one another. This influences the level of interest rates for everyone. The main goal of the BoC is to maintain inflation at 1-3% by adjusting interest rates up or down. Relatively higher interest rates tend to be positive for the CAD. The Bank of Canada can also use quantitative easing and tightening to influence credit conditions, with the former CAD-negative and the latter CAD-positive.
The price of Oil is a key factor impacting the value of the Canadian Dollar. Petroleum is Canada’s biggest export, so Oil price tends to have an immediate impact on the CAD value. Generally, if Oil price rises CAD also goes up, as aggregate demand for the currency increases. The opposite is the case if the price of Oil falls. Higher Oil prices also tend to result in a greater likelihood of a positive Trade Balance, which is also supportive of the CAD.
While inflation had always traditionally been thought of as a negative factor for a currency since it lowers the value of money, the opposite has actually been the case in modern times with the relaxation of cross-border capital controls. Higher inflation tends to lead central banks to put up interest rates which attracts more capital inflows from global investors seeking a lucrative place to keep their money. This increases demand for the local currency, which in Canada’s case is the Canadian Dollar.
Macroeconomic data releases gauge the health of the economy and can have an impact on the Canadian Dollar. Indicators such as GDP, Manufacturing and Services PMIs, employment, and consumer sentiment surveys can all influence the direction of the CAD. A strong economy is good for the Canadian Dollar. Not only does it attract more foreign investment but it may encourage the Bank of Canada to put up interest rates, leading to a stronger currency. If economic data is weak, however, the CAD is likely to fall.
Recommended Articles


