EUR/JPY Price Analysis: Rallies to almost 16-year high, buyers eye 167.00

Source Fxstreet
  • EUR/JPY surges to levels not seen since August 2008, capitalizing on a broader Yen weakness.
  • Technical indicators suggest potential for further advances after clearing resistance at 165.30, towards the 169.47 high of August 2008.
  • Downside risks remain once EUR/JPY retreats below the recent high of 166.22.

The Euro rallied to a near 16-year high against the Japanese Yen, hitting levels last seen in August 2008, with the latter remaining the laggard in the FX space. Data from the United States (US) prompted investors to buy the Greenback, which sent USD/JPY to refresh multi-year highs. Therefore, the EUR/JPY followed suit and trades at 166.67, gaining more than 0.20%.

EUR/JPY Price Analysis: Technical outlook

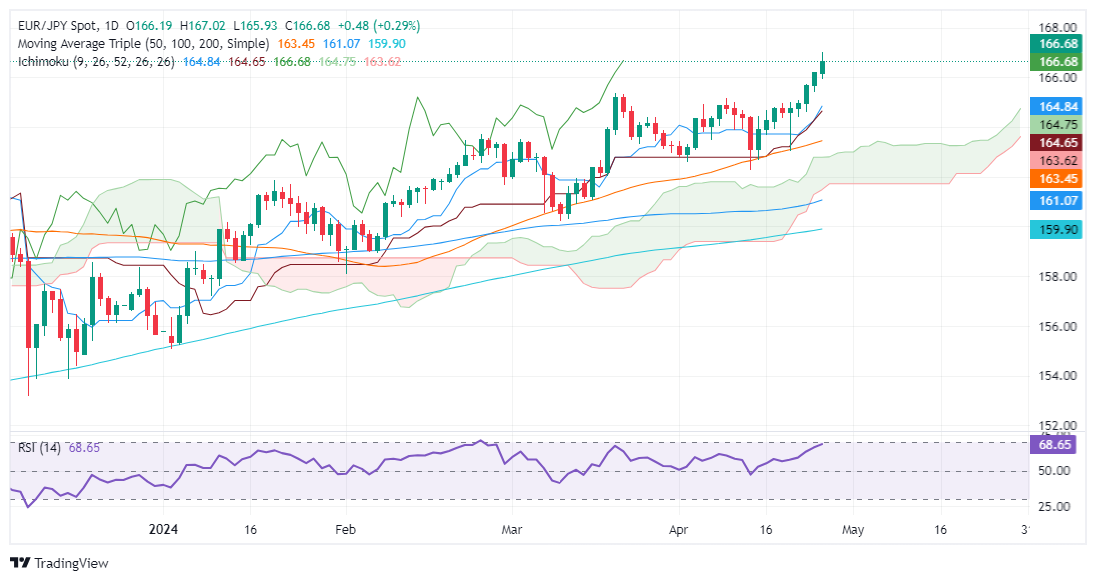
The EUR/JPY is bullish-biased after consolidating since mid-March below the 165.30s area, previously guarded by March’s 20 high at 165.33. The uptrend resumed toward the 166.00 mark, yet once buyers cleared that hurdle, extending the move to 167.00.

Nevertheless, the EUR/JPY has retreated as buyers take a breather. The momentum its on their side, as shown by the Relative Strength Index (RSI) standing at 68.80, shy of signaling the pair is overbought.

If buyers clear 167.00, that will exacerbate a rally to challenge August’s 2008 monthly high at 169.47, ahead of the psychological 170.00 barrier.

On the other hand, if sellers drag the exchange rate below 166.22 April 24 daily high, that could open the door to sliding toward the March 20 high of 165.33. Subsequent losses beyond this support target the confluence of the Tenkan and Kijun-Sen at 164.83/64.

EUR/JPY Price Action – Daily Chart
EUR/JPY

Overview
Today last price 166.71
Today Daily Change 0.51
Today Daily Change % 0.31
Today daily open 166.2
 
Trends
Daily SMA20 164.31
Daily SMA50 163.35
Daily SMA100 160.95
Daily SMA200 159.84
 
Levels
Previous Daily High 166.23
Previous Daily Low 165.4
Previous Weekly High 165.03
Previous Weekly Low 162.67
Previous Monthly High 165.36
Previous Monthly Low 160.22
Daily Fibonacci 38.2% 165.91
Daily Fibonacci 61.8% 165.72
Daily Pivot Point S1 165.65
Daily Pivot Point S2 165.11
Daily Pivot Point S3 164.82
Daily Pivot Point R1 166.49
Daily Pivot Point R2 166.78
Daily Pivot Point R3 167.32


Disclaimer: For information purposes only. Past performance is not indicative of future results.
placeholder
Nearly $2 Billion Wiped Out in Crypto Liquidations Amid Brutal Sell-OffThe crypto market experienced nearly $2 billion in liquidations over the past 24 hours, as the total market capitalization dropped below $3 trillion for the first time in five months.Bitcoin (BTC) alo
Author  Beincrypto
8 hours ago
The crypto market experienced nearly $2 billion in liquidations over the past 24 hours, as the total market capitalization dropped below $3 trillion for the first time in five months.Bitcoin (BTC) alo
placeholder
Market Meltdown: BTC, ETH, and XRP Capitulate as Bears Seize ControlBitcoin trades around $85,900 after breaking below $86,000, with Ethereum under $2,791 and XRP below $1.99 as BTC, ETH and XRP extend weekly losses of 8–10%, forcing traders to focus on supports at $85,000, $2,749 and $1.77 for clues on whether this sell-off has further to run.
Author  Mitrade
14 hours ago
Bitcoin trades around $85,900 after breaking below $86,000, with Ethereum under $2,791 and XRP below $1.99 as BTC, ETH and XRP extend weekly losses of 8–10%, forcing traders to focus on supports at $85,000, $2,749 and $1.77 for clues on whether this sell-off has further to run.
placeholder
Bitcoin's Drop to $86K Approaches 'Max Pain' Zone, Yet Presents Potential Buying OpportunityAnalysts identify the $84,000 to $73,000 range as Bitcoin's likely "max pain" territory where capitulation may occur.
Author  Mitrade
15 hours ago
Analysts identify the $84,000 to $73,000 range as Bitcoin's likely "max pain" territory where capitulation may occur.
placeholder
Whale Dump Meets Quantum Panic: Bitcoin Slips to $86,000 and Blows $220 Million LongsBitcoin fell below $87,000 on November 20, 2025, amid a storm of quantum security fears and $1.3 billion whale capitulation. In the process, it blew almost $220 million in long positions out of the wa
Author  Beincrypto
15 hours ago
Bitcoin fell below $87,000 on November 20, 2025, amid a storm of quantum security fears and $1.3 billion whale capitulation. In the process, it blew almost $220 million in long positions out of the wa
placeholder
EUR/USD dives further as traders pare back Fed cuts betsEUR/USD extends losses for the fifth consecutive day and trades at 1.1520 at the time of writing on Thursday after a sharp reversal from levels near 1.1600 on Wednesday.
Author  FXStreet
Yesterday 10: 42
EUR/USD extends losses for the fifth consecutive day and trades at 1.1520 at the time of writing on Thursday after a sharp reversal from levels near 1.1600 on Wednesday.
goTop
quote