CFDs are complex instruments and come with a high risk of losing money rapidly due to leverage. You should consider whether you understand how CFDs work and whether you can afford to take the high risk of losing your money.
    Mitrade Insights is dedicated to providing investors with rich, timely and most valuable financial information to help investors grasp the market situation and find timely trading opportunities.
    2021
    Best News & Analysis Provider
    FxDailyInfo
    2022
    Best Forex Educational Resources Global
    International Business Magazine

    AUD/JPY Price Analysis: Bulls steer the market towards 101.00, its highest since 2014

    Source Fxstreet
    Apr 24, 2024 20:00
    • The daily RSI of the AUD/JPY continues its uphill journey, nearing overbought territory, amplifying buying traction.
    • Hourly indicators are also strong, with no signs of bears.
    • A healthy correction shouldn't be ruled out.

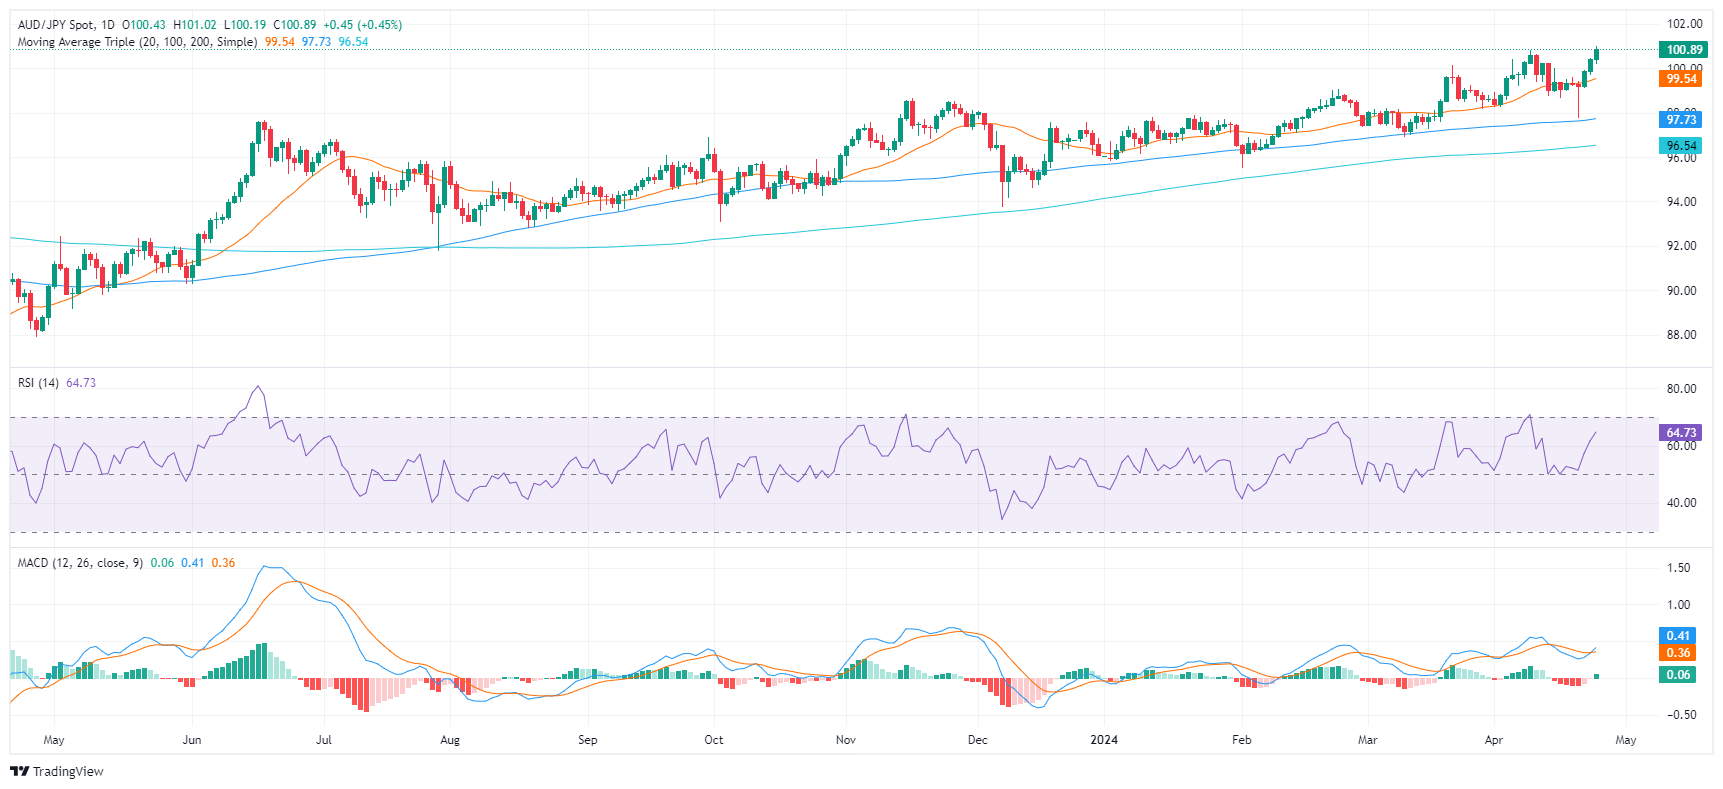
    The AUD/JPY market showcases an increasingly bullish trend. The cross stabilized at 100.89 on Wednesday, after rallying to a high at 101.12, its highest since 2014. The general market interest leans towards the buyers as the pair follows an upward trend and surpasses significant levels. However, as the pair gained nearly 1.50% in the last sessions, the cross might be poised for a correction.

    On the daily chart, the Relative Strength Index (RSI) of the AUD/JPY pair continues its upward trajectory nearing overbought territory. The Moving Average Convergence Divergence (MACD) also supports the buyers, as it prints a fresh green bar.

    AUD/JPY daily chart
    Switching the focus to the hourly chart, the hourly Relative Strength Index (RSI) displays a generally increasing trend, pointing toward positive short-term momentum. In addition, the MACD portrays decreasing red bars, denoting the declining momentum of the sellers in the short-term trading hours.

    AUD/JPY hourly chart
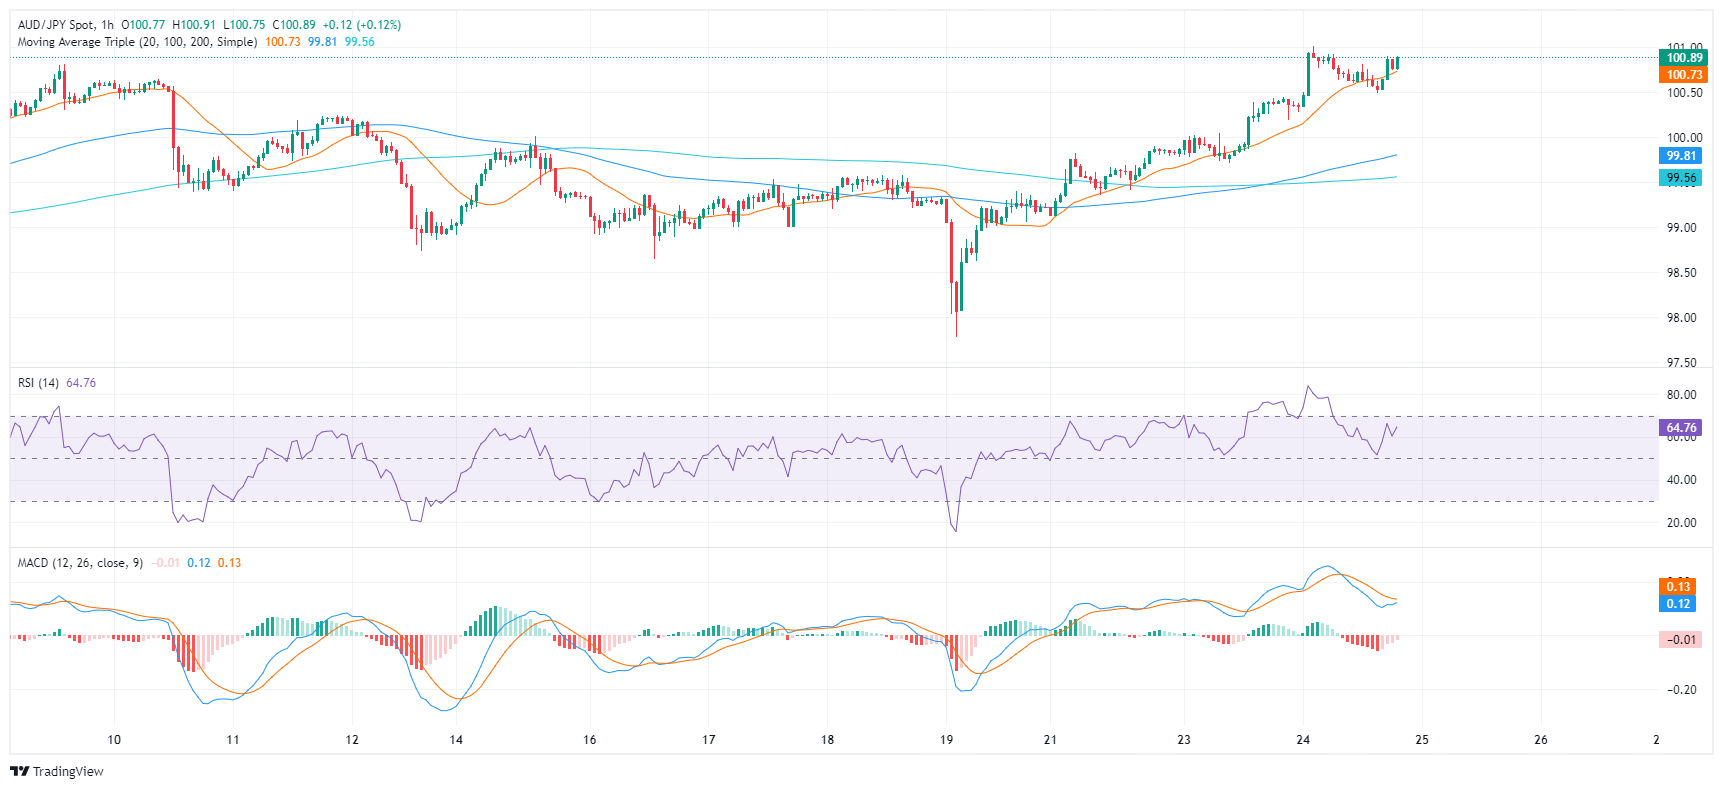
    In the broader outlook, the AUD/JPY indicates a bullish trend, given its current position above the 20, 100, and 200-day Simple Moving Average (SMA). SMAs serve as technical indicators for analyzing price trends by smoothing out price fluctuations. The pair's stance above all three SMAs suggests a strong stance from the bull in the short and long-term perspectives. In addition, the pair rallying to multi-year highs suggests that the bulls are clearly in command, but traders shouldn't be ruled out as indicators might run out of steam.


    AUD/JPY

    Overview
    Today last price 100.89
    Today Daily Change 0.46
    Today Daily Change % 0.46
    Today daily open 100.43
     
    Trends
    Daily SMA20 99.44
    Daily SMA50 98.69
    Daily SMA100 97.69
    Daily SMA200 96.5
     
    Levels
    Previous Daily High 100.45
    Previous Daily Low 99.71
    Previous Weekly High 100.02
    Previous Weekly Low 97.78
    Previous Monthly High 100.17
    Previous Monthly Low 96.9
    Daily Fibonacci 38.2% 100.17
    Daily Fibonacci 61.8% 99.99
    Daily Pivot Point S1 99.94
    Daily Pivot Point S2 99.46
    Daily Pivot Point S3 99.21
    Daily Pivot Point R1 100.68
    Daily Pivot Point R2 100.94
    Daily Pivot Point R3 101.42


    Disclaimer: For information purposes only. Past performance is not indicative of future results.
    placeholder
    Mexican Peso gains against US Dollar ahead of key FOMC decisionThe Mexican Peso recovered some ground against the US Dollar on Wednesday as traders braced for a busy economic docket in the United States (US).
    Source  Fxstreet
    The Mexican Peso recovered some ground against the US Dollar on Wednesday as traders braced for a busy economic docket in the United States (US).
    placeholder
    GBP/USD Price Analysis: Wavers below 1.2500 as bearish harami loomsThe Pound Sterling is virtually unchanged against the US Dollar following the release of mixed Purchasing Managers Index (PMI) data from S&P Global and the Institute for Supply Management (ISM).
    Source  Fxstreet
    The Pound Sterling is virtually unchanged against the US Dollar following the release of mixed Purchasing Managers Index (PMI) data from S&P Global and the Institute for Supply Management (ISM).
    placeholder
    USD/CHF Price Analysis: Extends the rally above 0.9200  amid the overbought conditionThe USD/CHF pair extends its upside to 0.9210 on Wednesday during the early European session.
    Source  Fxstreet
    The USD/CHF pair extends its upside to 0.9210 on Wednesday during the early European session.
    goTop
    quote