

EUR/USD recovers after US economic myth dented
- EUR/USD climbs above the key 1.0700 psychological level early on Wednesday.
- Weaker-than-expected US PMI data on Tuesday undermined the US Dollar and fueled the recovery.
- EUR/USD’s Bear Flag pattern deforms, bringing into doubt its validity.
EUR/USD trades just shy of 1.0700 on Wednesday after weaker-than-expected private sector growth and US business activity dent the myth of US economic exceptionalism, weighing on the US Dollar (USD).
EUR/USD gains a further small bump after the release of positive German economic sentiment IFO survey data for April shows a greater-than-expected rise in the Business Climate (89.4) and Current Assessment (88.9) components, whilst Expectations increases to 89.9 in line with estimates.
EUR/USD recovers on weaker-than-expected US data
EUR/USD broke above the top of its seven-day range early on Wednesday after the Greenback lost favor with traders. The Euro (EUR), meanwhile, maintained its value on the back of growth in the Services sector revealed in Tuesday’s better-than-expected HCOB Eurozone Services PMI data for April.
In comparison, the PMI indexes from the US fell for both Services and Manufacturing in April, which took investors by surprise and suggested the economy is not coping as well as previously thought under the yoke of relatively high interest rates.
Stubborn price momentum in the services sector in both the US and Europe have delayed the time by which both the Federal Reserve (Fed) and European Central Bank (ECB) are expected to cut interest rates. Whilst ECB officials seem fairly united in wanting to cut the ECB’s base lending rate in June, Fed officials have become increasingly vague about when they might consider cutting interest rates.
Since the expectation of lower interest rates depreciates a currency, the lack of commitment of Fed officials compared to their ECB colleagues has been the main catalyst behind the US Dollar’s outperformance over recent weeks, and EUR/USD’s bearish momentum.
The higher-than-expected preliminary Services PMI data in the Eurozone revealed on Tuesday, however, introduces some doubt into confidence that the ECB will in fact go ahead with rate cuts in June.
On Wednesday, ECB governing council member and Bundesbank President Joachim Nagel reflected this doubt, saying “Services inflation remains high, driven by continued strong wage growth,” and because of this he was not convinced inflation was falling in a sustainable manner and, therefore, could not “pre-commit to a particular rate path.”
It means more weight will be given to the defining data point for the decision, which is – according to the ECB President Christine Lagarde – first quarter Eurozone wage growth data.
EUR/USD traders will now assess commentary from ECB officials on Wednesday. Meanwhile in the US, Durable Goods data will pad out the portrait of how well “Captain American Economy” is doing when it is released during the US session.
Technical Analysis: EUR/USD pierces top of short-term range
EUR/USD breaks out of the box-like range it had been trading in for the last seven days and pierces above the key 1.0700 level to bring into doubt the durability of the short-term downtrend.
It is now less certain EUR/USD is forming a Bear Flag price pattern as had previously been assumed. The pattern has quite bearish connotations with a potential downside target in the 1.0400s, so if it fails to activate the pair could reverse on the disappointment, with some short-covering adding fuel to the recovery.
EUR/USD 4-hour Chart
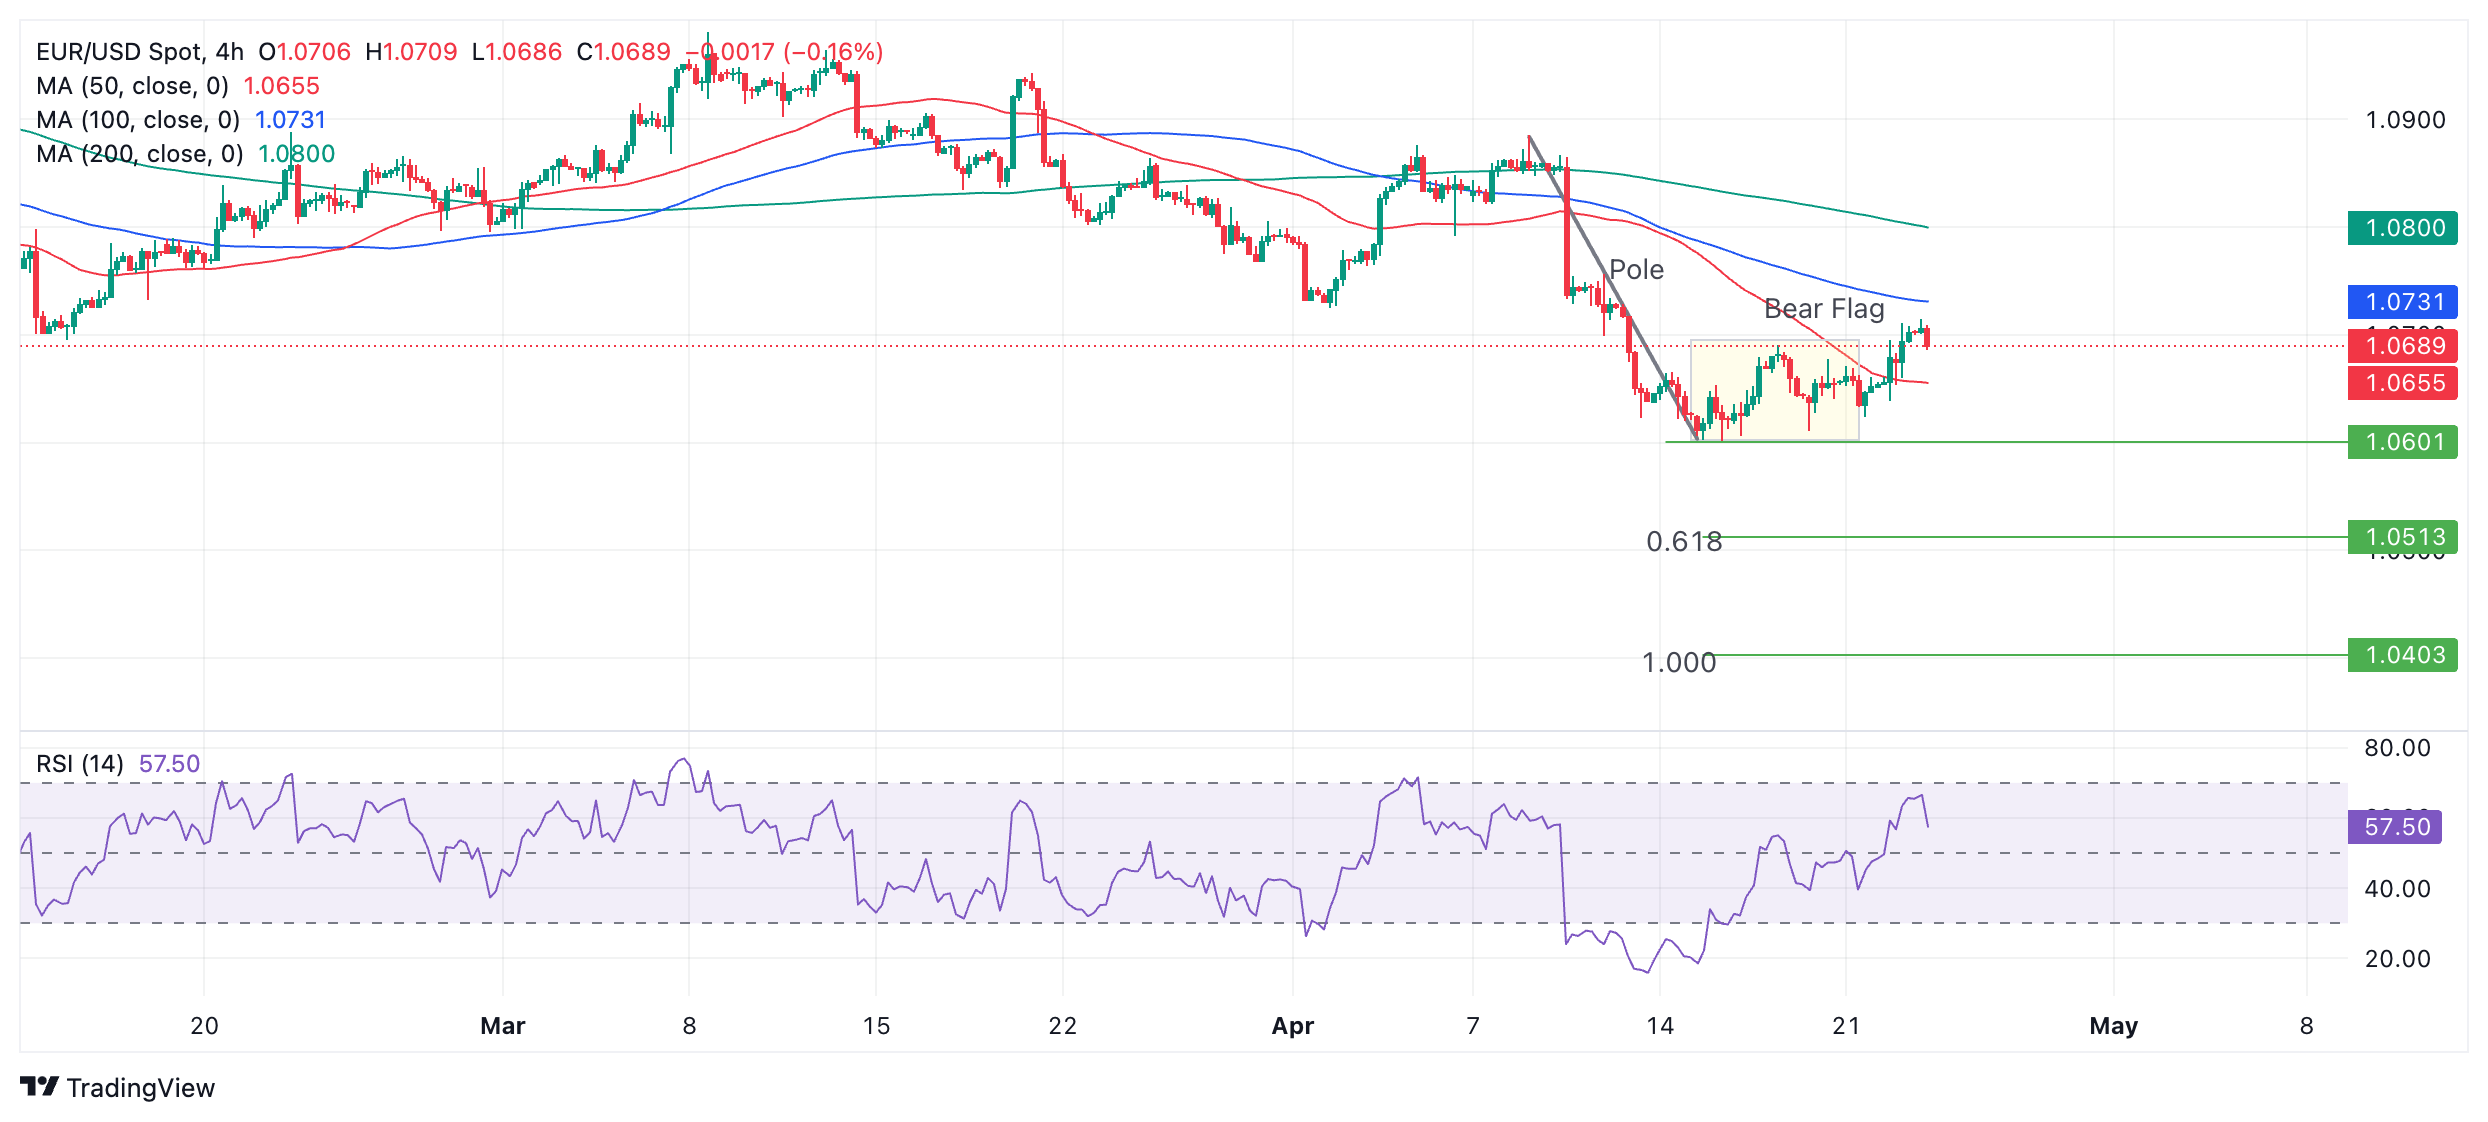
With the short-term downtrend in doubt more upside is possible, with the next target at resistance from the previous lower high providing an initial target at 1.0758. After that, the 50-day and 200-day Simple Moving Averages (SMA) provide resistance at 1.0807 on the daily chart (not shown).
A break below the 1.0601 April 16 low, however, would prove the Bear Flag hypothesis valid in the end and signal the start of a decline.
According to technical lore, the expected move out of a Bear Flag usually equals the length of the “pole” or steep decline preceding the box-like formation of the flag square, or a Fibonacci ratio of the pole.
The Fibonacci 0.618 ratio of the pole extrapolated lower provides the most reliable conservative target. This gives a price objective at 1.0503. After that, the next concrete target is at 1.0446 – the October 2023 low. A fall of equal length to the pole would take EUR/USD down to 1.0403.
Economic Indicator
IFO – Business Climate
This German business sentiment index released by the CESifo Group is closely watched as an early indicator of current conditions and business expectations in Germany. The Institute surveys more than 7,000 enterprises on their assessment of the business situation and their short-term planning. The positive economic growth anticipates bullish movements for the EUR, while a low reading is seen as negative (or bearish).
Read more.Last release: Wed Apr 24, 2024 08:00
Frequency: Monthly
Actual: 89.4
Consensus: 88.9
Previous: 87.8
Source: IFO Institute
Recommended Articles


