GBP/USD Price Analysis: Bulls stepped in as ‘morning star’ chart pattern looms

Source Fxstreet
  • GBP/USD surges over 0.65% following disappointing US economic figures.
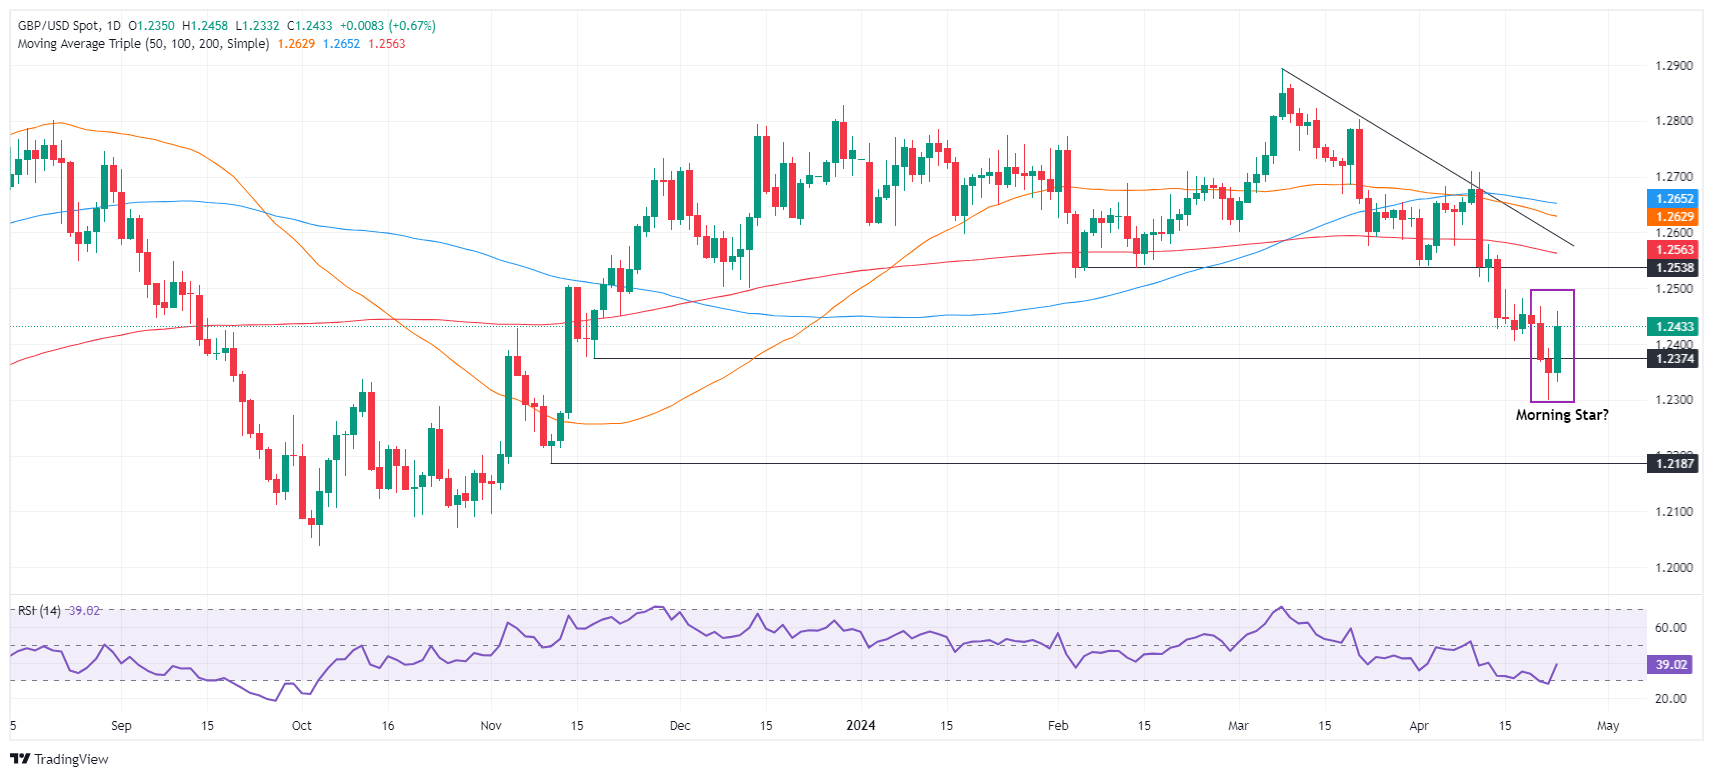
  • Technical analysis indicates a potential upward movement if GBP/USD sustains a close near 1.2440, completing a 'morning star' pattern.
  • Key resistances are ahead at 1.2500 and the 200-day moving average at 1.2565; downside risks persist below 1.2400.

The Pound Sterling rallied early in the North American session, gaining more than 0.65% against the US Dollar after softer-than-expected data from the United States (US), which could spur the Federal Reserve to begin to ease policy faster than expected. The GBP/USD trades at 1.2434, after bouncing off lows hit at 1.2331.

GBP/USD Price Analysis: Technical outlook

From a technical perspective, the GBP/USD is still downward biased, as key resistance levels remain respected by price action. However, if the major achieves a daily close around the 1.2440 area, that will complete a ‘morning star’ candlestick chart pattern, suggesting the pair could aim higher.

In that event, the GBP/USD first resistance would be the 1.2500 psychological level. Once broken, further gains are seen, with the 200-day moving average (DMA) up next at 1.2565, ahead of 1.2600. Key resistance levels emerge at the 50-DMA at 1.2628 and the 100-DMA at 1.2649.

On the flip side, further losses are seen if the pair drops below 1.2400. A breach of the latter would pave the way to challenge the year-to-date (YTD) low of 1.2299.

GBP/USD Price Action – Daily Chart


Disclaimer: For information purposes only. Past performance is not indicative of future results.
placeholder
Bitcoin Price Forecast: BTC battles at key technical zone amid mixed flow signalsBitcoin (BTC) steadies around the key technical support on Tuesday after its recent correction. The Crypto King’s next directional move could hinge on this key technical zone.
Author  FXStreet
9 hours ago
Bitcoin (BTC) steadies around the key technical support on Tuesday after its recent correction. The Crypto King’s next directional move could hinge on this key technical zone.
placeholder
WTI declines below $102.00 after Trump says he called off Iran attacksWest Texas Intermediate (WTI), the US crude oil benchmark, is trading around $101.85 during the early Asian trading hours on Tuesday. The WTI price declines after US President Donald Trump said he was holding off a military attack on Iran planned for Tuesday at the request of Gulf states.
Author  FXStreet
18 hours ago
West Texas Intermediate (WTI), the US crude oil benchmark, is trading around $101.85 during the early Asian trading hours on Tuesday. The WTI price declines after US President Donald Trump said he was holding off a military attack on Iran planned for Tuesday at the request of Gulf states.
placeholder
Iran Situation Rekindles Threat of War. Bitcoin Price Decline Accelerates, $75,000 Geopolitical Defense Line Faces TestU.S.-Israel discussions on resuming strikes against Iran trigger an accelerated Bitcoin price pullback; future gains depend on whether the $75,000 support level holds.On May 18, the poten
Author  TradingKey
Yesterday 09: 03
U.S.-Israel discussions on resuming strikes against Iran trigger an accelerated Bitcoin price pullback; future gains depend on whether the $75,000 support level holds.On May 18, the poten
placeholder
Euro softens to near 1.1600 on US–Iran tensions The EUR/USD pair trades in negative territory around 1.1615 during the early Asian session on Monday. The Euro (EUR) extends the decline as the prolonged US-Iran conflict weighs on the riskier assets.
Author  FXStreet
Yesterday 01: 34
The EUR/USD pair trades in negative territory around 1.1615 during the early Asian session on Monday. The Euro (EUR) extends the decline as the prolonged US-Iran conflict weighs on the riskier assets.
placeholder
Financial Markets 2026: Volatility Catalysts in Gold, Silver, Oil, and Blue-Chip Stocks—A CFD Trader's OutlookGet a comprehensive financial market 2026 outlook exploring key economic drivers, volatility catalysts in gold, oil and stocks, and what the evolving economic outlook means for cfd trading strategies and risk management on global markets.
Author  Rachel Weiss
May 15, Fri
Get a comprehensive financial market 2026 outlook exploring key economic drivers, volatility catalysts in gold, oil and stocks, and what the evolving economic outlook means for cfd trading strategies and risk management on global markets.
Related Instrument
goTop
quote