


Mexican Peso trades mixed as PMIs test health of global economy
- The Mexican Peso trades mixed as global Purchasing Manager Indices (PMI) for April are released.
- Mexican Economic Activity data failed to inject much volatility into the Peso on Monday.
- The short-term uptrend looks vulnerable to breakdown.
The Mexican Peso (MXN) is trading mixed on Tuesday after plummeting temporarily at the end of last week, but then reverting to mean after fears of an escalation in the conflict in the Middle East abated.
Mexican Peso shrugs off macro data
The Mexican Peso did not gain much traction on Monday despite the release of better-than-expected macroeconomic data for February. Economic Activity rose 1.4% MoM and 4.4% YoY in the second month of the year compared to January’s 0.9% and 1.9% increases, respectively, according to data from the Instituto Nacional de Estadistica, Geografia e Informatica (INEGI).
Other news relevant to MXN included comments from Banxico Governor Victoria Rodriguez Ceja, who said that services inflation is not showing a clear downward trend.
Rodriguez Ceja added that the Mexican Peso’s strength has, at times, helped contain inflation by lowering the cost of imported goods.
Her comments reinforce the view that the central bank will be data dependent in its approach to monetary policy going forward.
In March, Banxico cut interest rates by 0.25% for the first time in three years after inflation showed progress lower. The minutes of the meeting, however, showed a lack of conviction about whether inflation had fallen in a sustainable fashion. This suggested another cut at their next meeting in May is not guaranteed.
Mexican mid-month inflation data for April, out on Wednesday, could adjust expectations for the Banxico’s policy approach going forward.
Mid-month inflation in March stood at 4.48% for headline and 4.69% for core YoY, and 0.27% and 0.33%, respectively, on a monthly basis.
A higher-than-previous result is likely to further lower the probability of the central bank following up the March rate cut with another cut in the near term, and vice versa for a lower-than-previous result.
Interest rates are a major driver of Forex markets. Higher interest rates appreciate a currency by attracting more inflows of foreign capital and the opposite for lower interest rates.
Tuesday also sees the release of key global macroeconomic data in the form of April Purchasing Manager Indices (PMI) for most major economies (although Mexico’s PMIs are not scheduled for release until May 2).
Eurozone PMIs have already been released and showed mixed results, with gains in Services but a deeper-than-forecast decline in Manufacturing PMI.
S&P Global PMIs for the US are scheduled for release at 13:45 GMT and could inject volatility into markets, especially for the most heavily traded MXN pair the USD/MXN.
Technical Analysis: USD/MXN short-term uptrend vulnerable
USD/MXN continues to trade below a major trendline for the long-term downtrend, despite briefly breaking above the line last week during the highly volatile reaction to the Israel-Iran conflict.
The brief piercing of the trendline and spike higher reversed the short-term and intermediate-term downtrends but not the longer-term trend, which remains bearish.
USD/MXN 4-hour Chart
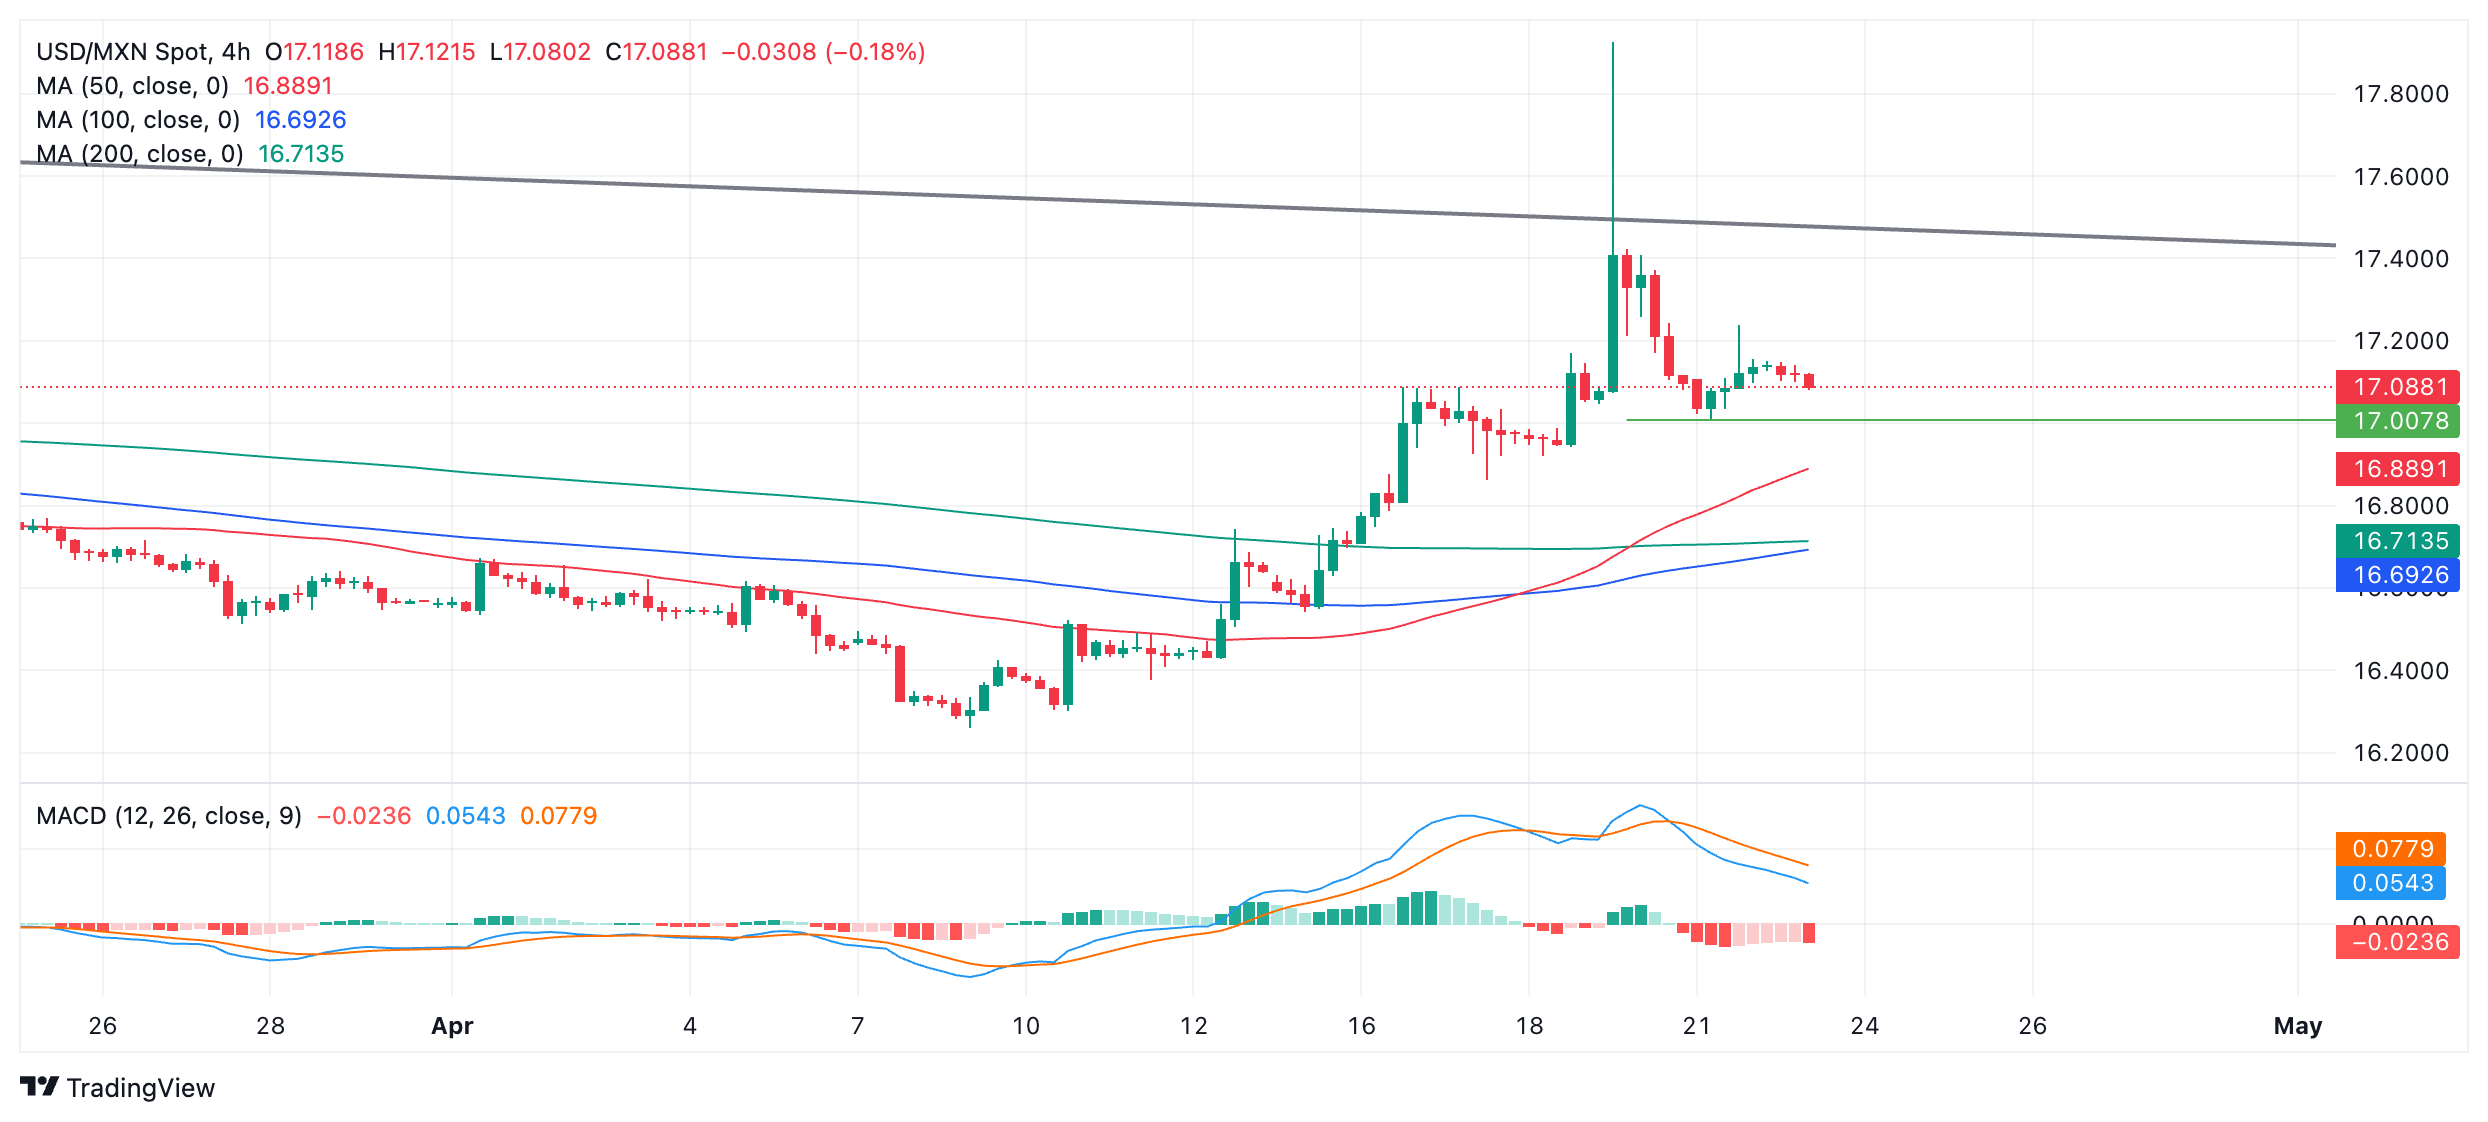
A closer look at the 4-hour chart shows that the new short-term uptrend is vulnerable. A break below Monday’s 17.01 swing low would bring the short-term uptrend into doubt.
The Moving Average Convergence/Divergence (MACD) has crossed its signal line, giving a sell signal and is falling in line with price, overall painting a bearish picture.
If a pullback persists, support from the 100-day SMA at 16.96 followed by the 50-day SMA at 16.82 is likely to provide a foothold for the backsliding price.
A decisive break above the trendline at roughly 17.45 would provide bullish reconfirmation and activate an upside target at roughly 18.15.
A decisive break would be one characterized by a longer-than-average green daily candlestick that pierces above the trendline and closes near its high, or three green candlesticks in a row that pierce above the level.
Banxico FAQs
The Bank of Mexico, also known as Banxico, is the country’s central bank. Its mission is to preserve the value of Mexico’s currency, the Mexican Peso (MXN), and to set the monetary policy. To this end, its main objective is to maintain low and stable inflation within target levels – at or close to its target of 3%, the midpoint in a tolerance band of between 2% and 4%.
The main tool of the Banxico to guide monetary policy is by setting interest rates. When inflation is above target, the bank will attempt to tame it by raising rates, making it more expensive for households and businesses to borrow money and thus cooling the economy. Higher interest rates are generally positive for the Mexican Peso (MXN) as they lead to higher yields, making the country a more attractive place for investors. On the contrary, lower interest rates tend to weaken MXN. The rate differential with the USD, or how the Banxico is expected to set interest rates compared with the US Federal Reserve (Fed), is a key factor.
Banxico meets eight times a year, and its monetary policy is greatly influenced by decisions of the US Federal Reserve (Fed). Therefore, the central bank’s decision-making committee usually gathers a week after the Fed. In doing so, Banxico reacts and sometimes anticipates monetary policy measures set by the Federal Reserve. For example, after the Covid-19 pandemic, before the Fed raised rates, Banxico did it first in an attempt to diminish the chances of a substantial depreciation of the Mexican Peso (MXN) and to prevent capital outflows that could destabilize the country.
Recommended Articles


