
EUR/USD consolidates losses with Eurozone data in focus
- EUR/USD flatlines below 1.1700 ahead of a string of Eurozone sentiment indicators.
- German Factory Orders beat expectations in November.
- Markets are on a wait-and-see stance ahead of Friday's US NFP report.
EUR/USD is trading in a tight range, capped below 1.1700 for the second day in a row. The pair changes hands at 1.1680 at the time of writing, unfazed by the upbeat German Factory Orders data, and ahead of Eurozone employment figures and economic and industrial confidence data from the region.
On Wednesday, a set of mixed US data failed to provide any particular hint on the US Federal Reserve's (Fed) monetary policy path. Employment-related data confirmed that the labour market remains stalled, but an upbeat services sector report pointed to a significant economic recovery in the last quarter of 2025.
On Thursday's calendar, a slew of Eurozone indicators might give some boost to the Euro (EUR), although investors are likely to remain wary of placing large US Dollar (USD) directional bets ahead of the release of December's Nonfarm Payrolls report on Friday.
Euro Price Today
The table below shows the percentage change of Euro (EUR) against listed major currencies today. Euro was the strongest against the Australian Dollar.
| USD | EUR | GBP | JPY | CAD | AUD | NZD | CHF | |
|---|---|---|---|---|---|---|---|---|
| USD | -0.02% | 0.03% | -0.16% | 0.12% | 0.36% | 0.32% | -0.08% | |
| EUR | 0.02% | 0.05% | -0.13% | 0.15% | 0.39% | 0.35% | -0.06% | |
| GBP | -0.03% | -0.05% | -0.17% | 0.09% | 0.33% | 0.29% | -0.11% | |
| JPY | 0.16% | 0.13% | 0.17% | 0.26% | 0.51% | 0.44% | 0.06% | |
| CAD | -0.12% | -0.15% | -0.09% | -0.26% | 0.25% | 0.20% | -0.20% | |
| AUD | -0.36% | -0.39% | -0.33% | -0.51% | -0.25% | -0.04% | -0.44% | |
| NZD | -0.32% | -0.35% | -0.29% | -0.44% | -0.20% | 0.04% | -0.40% | |
| CHF | 0.08% | 0.06% | 0.11% | -0.06% | 0.20% | 0.44% | 0.40% |
The heat map shows percentage changes of major currencies against each other. The base currency is picked from the left column, while the quote currency is picked from the top row. For example, if you pick the Euro from the left column and move along the horizontal line to the US Dollar, the percentage change displayed in the box will represent EUR (base)/USD (quote).
Daily Digest Market Movers: Low market volatility ahead of the NFP report
- US data failed to provide any clear hint about the US Federal Reserve's rate path in the short term and left investors looking for Friday's Nonfarm Payrolls report for further guidance.
- On Wednesday, the ADP Employment report showed a lower-than-expected increase in net jobs in December, 41K against the market consensus of 47K, while November's decline was revised down to -29K from the -32K previously estimated.
- Job openings failed to improve the outlook of the labour market. November's JOLTS report revealed that vacancies dropped to 7.1 million in November, below the 7.6 million anticipated by market analysts, and also below the upwardly revised 7.449 million openings seen in October.
- On the positive side, the US ISM Services Purchasing Managers' Index (PMI) jumped to 54.4 in December, its highest reading in more than a year, from 52.6 in November.
- Data released on Thursday revealed that German Factory Orders rose 5.6% in November, after the 1.6% growth seen in October, beating expectations of a 1% drop. Year on Year, orders bounced up 10.5% in November following a 0.7% drop in October.
- Later on Thursday, the Eurozone Unemployment data is expected to show that the jobless rate remained steady, at 6.4% in November.
- At the same time, the European Commission will release a string of sentiment indexes. The Economic Sentiment Indicator is seen unchanged at 97.0 in December. The Consumer Confidence Index is also seen unchanged at -14.6, while Industrial Confidence is expected to tick up to -9.1 from -9.3 in November.
- In the US, weekly Jobless Claims are expected to have increased to 210,000 in the last week of December from 199,000 in the previous week. The impact of these figures, however, is likely to be limited with the all-important Nonfarm Payrolls report around the corner.
Technical Analysis: EUR/USD is on a bearish correction from 1.1808
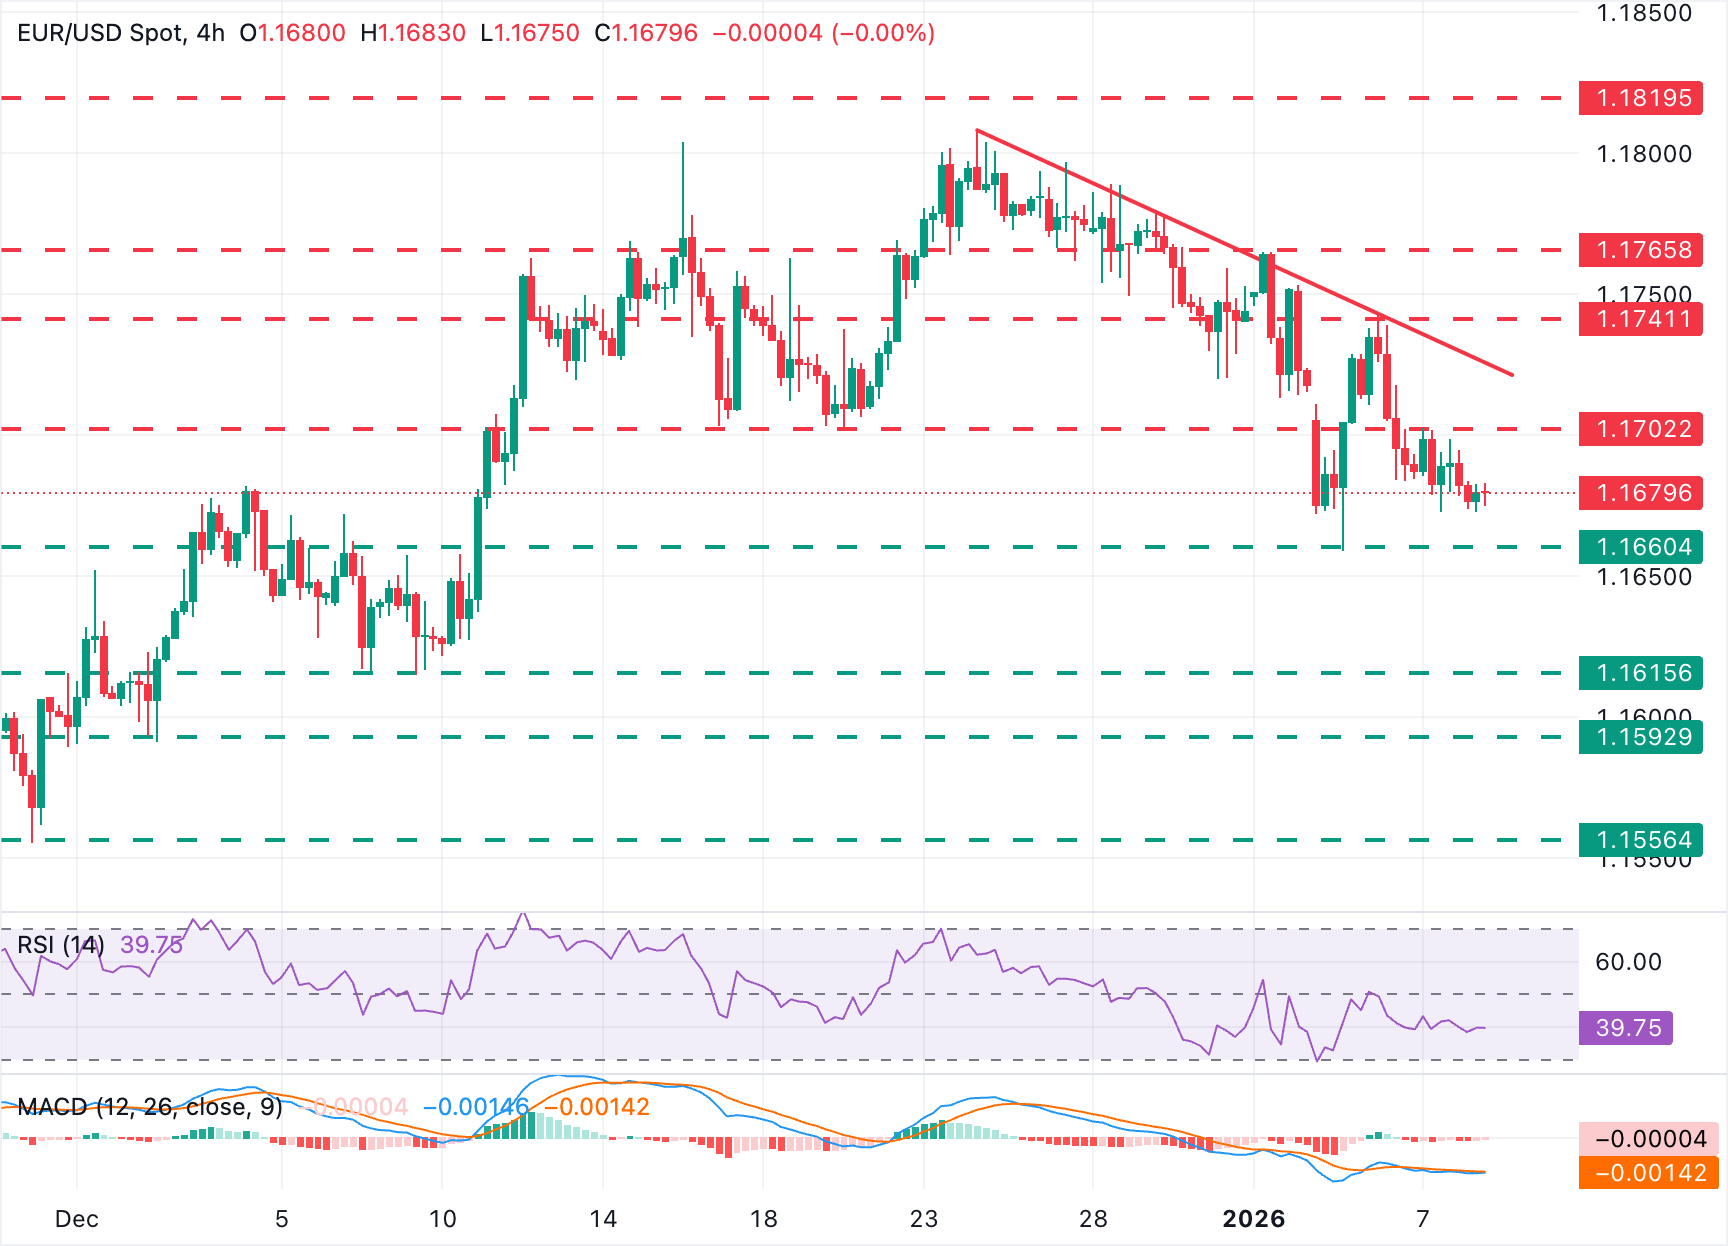
The EUR/USD bearish trend from December highs of 1.1808 remains in play, with support at the 1.1660 area holding bears for now. Technical indicators in the 4-hour chart are mildly negative. The 4-hour Moving Average Convergence Divergence (MACD) histogram bars are moving around the zero level, suggesting a lack of momentum, while the Relative Strength Index (RSI) flatlined around the 40 level.
The January 5 low of 1.1659 is closing the path towards the December 8 and 9 lows, in the area of 1.1615. Upside attempts, on the contrary, remain capped below Wednesday's high, near 1.1700. Further up, the descending trendline from December highs, now at 1.1725, and Tuesday's high, at 1.1740, are the next targets.
Economic Indicator
Factory Orders n.s.a. (YoY)
The Factory orders released by the Deutsche Bundesbank is an indicator that includes shipments, inventories, and new and unfilled orders. An increase in the factory order total may indicate an expansion in the German economy and could be an inflationary factor. It is worth noting that the German Factory barely influences, either positively or negatively, the total Eurozone GDP. A high reading is positive (or bullish) for the EUR, while a low reading is negative.
Read more.Last release: Thu Jan 08, 2026 07:00
Frequency: Monthly
Actual: 10.5%
Consensus: -
Previous: -0.7%
Source: Federal Statistics Office of Germany
Economic Indicator
Factory Orders s.a. (MoM)
The Factory orders released by the Deutsche Bundesbank is an indicator that includes shipments, inventories, and new and unfilled orders. An increase in the factory order total may indicate an expansion in the German economy and could be an inflationary factor. It is worth noting that the German Factory barely influences, either positively or negatively, the total Eurozone GDP. A high reading is positive (or bullish) for the EUR, while a low reading is negative.
Read more.Last release: Thu Jan 08, 2026 07:00
Frequency: Monthly
Actual: 5.6%
Consensus: -1%
Previous: 1.5%
Source: Federal Statistics Office of Germany
all-important
Recommended Articles


