NZD/USD Price Analysis: Bearish trend prevails, potential for further declines expected

Source Fxstreet
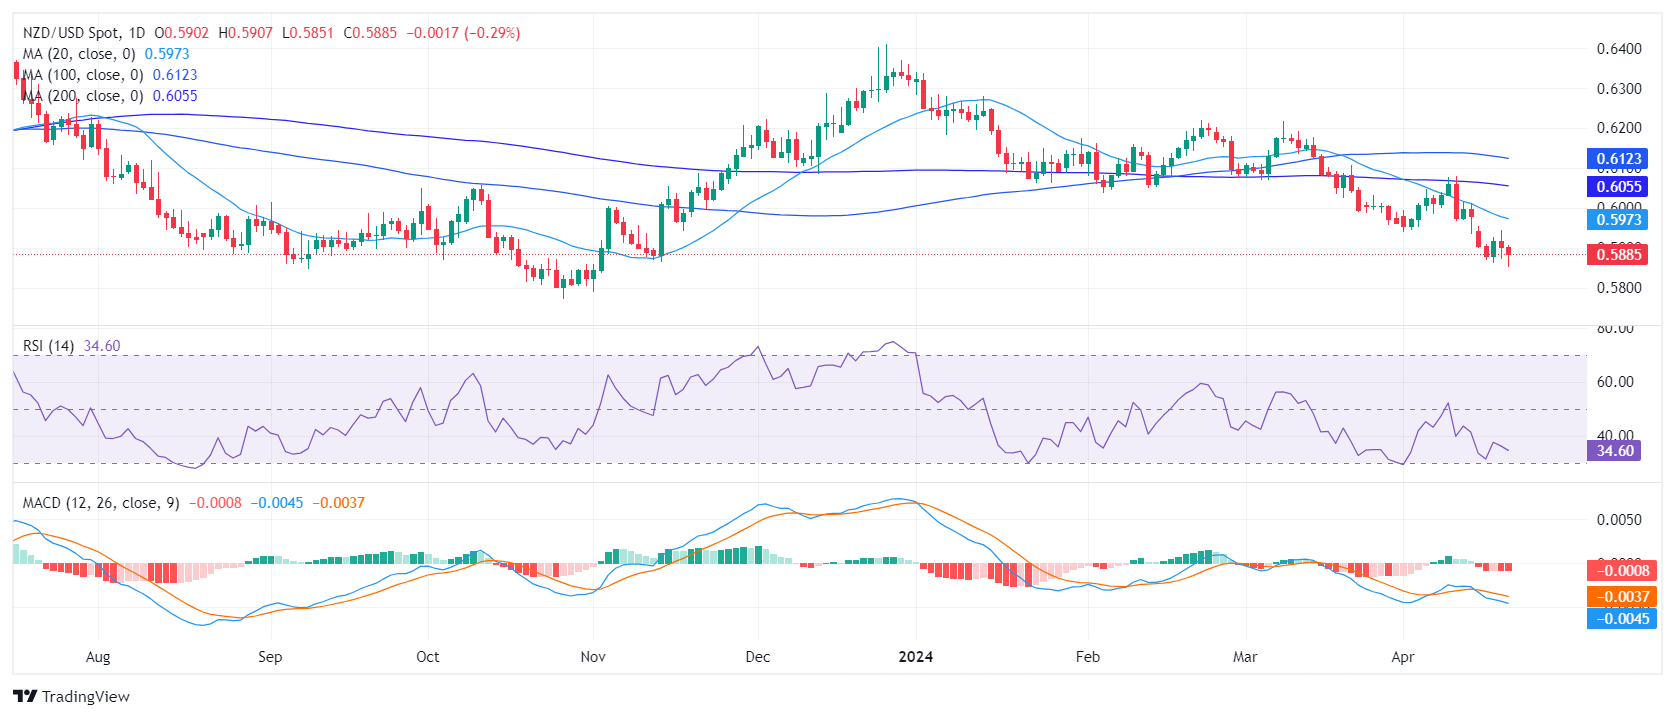
  • The daily RSI for the NZD/USD reveals growing selling pressure, nearing oversold conditions.
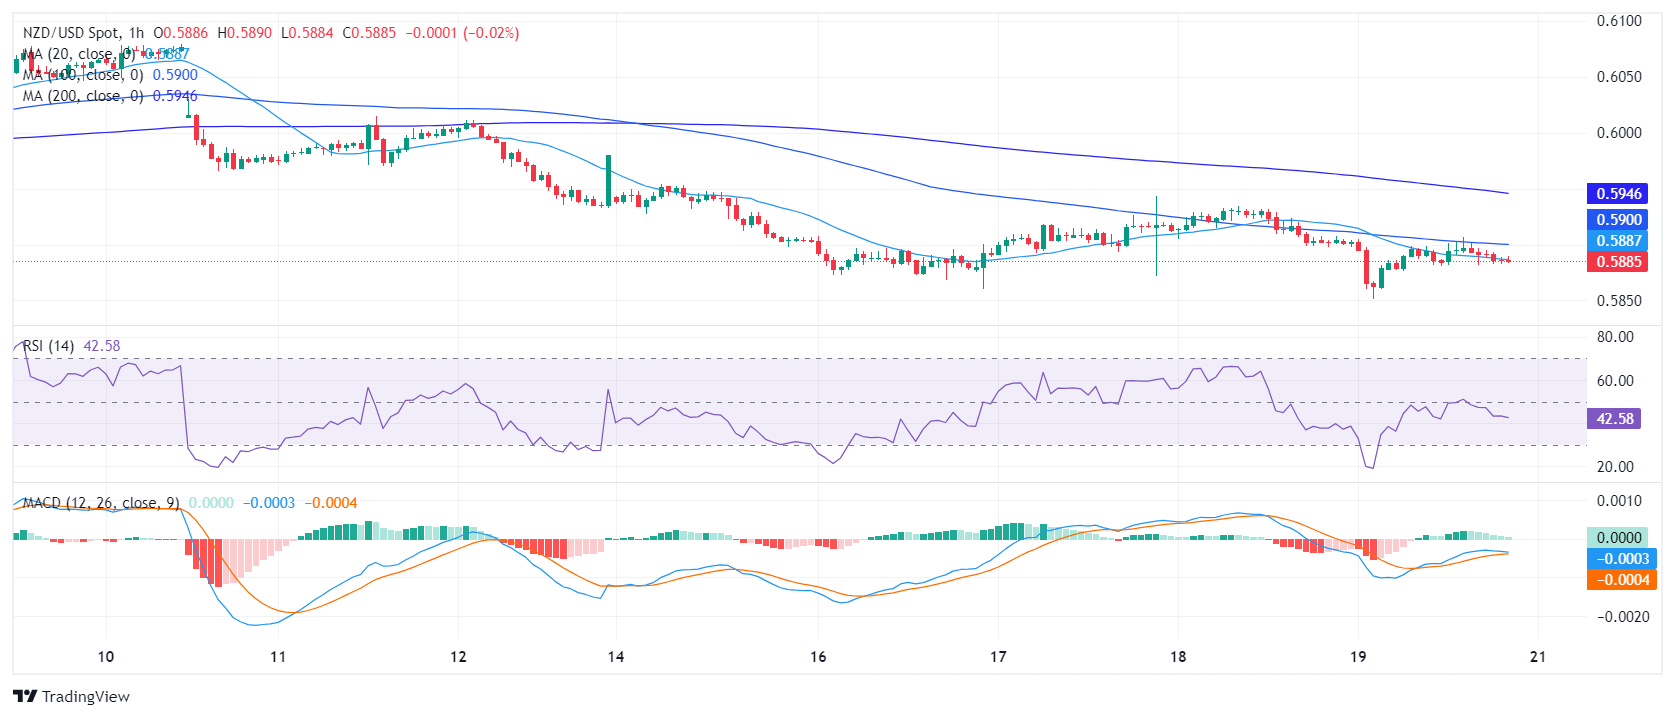
  • The hourly indicators also remain weak.
  • The pair will close a 0.80% losing week.

The NZD/USD pair saw a 0.25% loss on Friday’s sessing and continues exhibiting a significant bearish tendency. Both short-term and long-term outlooks suggest the prevalence of sellers, which may signal that the pair is bound for further downside.

On the daily chart, the Relative Strength Index (RSI) indicates a bearish trend. It lies deep in negative terrain and edged near oversold territory. The escalating red bars on the Moving Average Convergence Divergence (MACD) histogram align with this bearish stance, augmenting this downturn prediction.

NZD/USD daily chart

On the hourly chart, the  RSI also points south standing below 50 while the MACD exhibits dwindling green bars, indicative of reduced buying momentum.

NZD/USD hourly chart

From a wider viewpoint, NZD/USD presently exhibits a clear bearish trend, given its position below the Simple Moving Average (SMA) for 20, 100, and 200-day periods. However, as indicators approach oversold conditions, the pair may stage a corrective rebound which could give the buyers a chance to reclaim the 20-day SMA. In the meantime, movements below these levels would leave the trend bearish.

NZD/USD

Overview
Today last price 0.5885
Today Daily Change -0.0017
Today Daily Change % -0.29
Today daily open 0.5902
 
Trends
Daily SMA20 0.5978
Daily SMA50 0.6067
Daily SMA100 0.6127
Daily SMA200 0.6057
 
Levels
Previous Daily High 0.5943
Previous Daily Low 0.5872
Previous Weekly High 0.6079
Previous Weekly Low 0.5933
Previous Monthly High 0.6218
Previous Monthly Low 0.5956
Daily Fibonacci 38.2% 0.5899
Daily Fibonacci 61.8% 0.5916
Daily Pivot Point S1 0.5869
Daily Pivot Point S2 0.5835
Daily Pivot Point S3 0.5798
Daily Pivot Point R1 0.594
Daily Pivot Point R2 0.5977
Daily Pivot Point R3 0.6011


Disclaimer: For information purposes only. Past performance is not indicative of future results.
placeholder
Natural Gas sinks to pivotal level as China’s demand slumpsNatural Gas price (XNG/USD) edges lower and sinks to $2.56 on Monday, extending its losing streak for the fifth day in a row. The move comes on the back of China cutting its Liquified Natural Gas (LNG) imports after prices rose above $3.0 in June. It
Author  FXStreet
Jul 01, 2024
Natural Gas price (XNG/USD) edges lower and sinks to $2.56 on Monday, extending its losing streak for the fifth day in a row. The move comes on the back of China cutting its Liquified Natural Gas (LNG) imports after prices rose above $3.0 in June. It
placeholder
Elon Musk’s xAI and Neuralink Launch New Funding Rounds​Billionaire Elon Musk recently raised funds for his two high-profile tech companies, xAI and Neuralink.
Author  Insights
Jun 03, 2025
​Billionaire Elon Musk recently raised funds for his two high-profile tech companies, xAI and Neuralink.
placeholder
The dollar weakened, equities dipped, and gold hit record highsThe dollar weakened, equities fell, and gold set new records on Wednesday as investors waited for a Fed rate cut later in the day.
Author  Cryptopolitan
Sep 17, 2025
The dollar weakened, equities fell, and gold set new records on Wednesday as investors waited for a Fed rate cut later in the day.
placeholder
ECB Policy Outlook for 2026: What It Could Mean for the Euro’s Next MoveWith the ECB likely holding rates steady at 2.15% and the Fed potentially extending cuts into 2026, EUR/USD may test 1.20 if Eurozone growth proves resilient, but weaker growth and an ECB pivot could pull the pair back toward 1.13 and potentially 1.10.
Author  Mitrade
Dec 26, 2025
With the ECB likely holding rates steady at 2.15% and the Fed potentially extending cuts into 2026, EUR/USD may test 1.20 if Eurozone growth proves resilient, but weaker growth and an ECB pivot could pull the pair back toward 1.13 and potentially 1.10.
placeholder
Gold Prices Under Pressure After Hitting $4,600, UBS: Safe-Haven Logic Unchanged But Only Delayed.Impacted by signs of easing geopolitical risks in the Middle East, international gold prices (XAUUSD) rebounded sharply after previously falling to the $4,100 level, at one point climbing
Author  TradingKey
Mar 25, Wed
Impacted by signs of easing geopolitical risks in the Middle East, international gold prices (XAUUSD) rebounded sharply after previously falling to the $4,100 level, at one point climbing
Related Instrument
goTop
quote