NZD/JPY Price Analysis: Bearish momentum strengthens as sellers reclaim the 20-day SMA

Source Fxstreet
  • The daily chart of the NZD/JPY indicates a weakening momentum, with RSI and MACD signifying rising selling pressure.
  • The NZD/JPY plunged below the crucial short-term 20-day SMA, hinting at immediate bearish prospects.
  • Despite recent bearish actions, the long-term outlook continues to favor buyers.

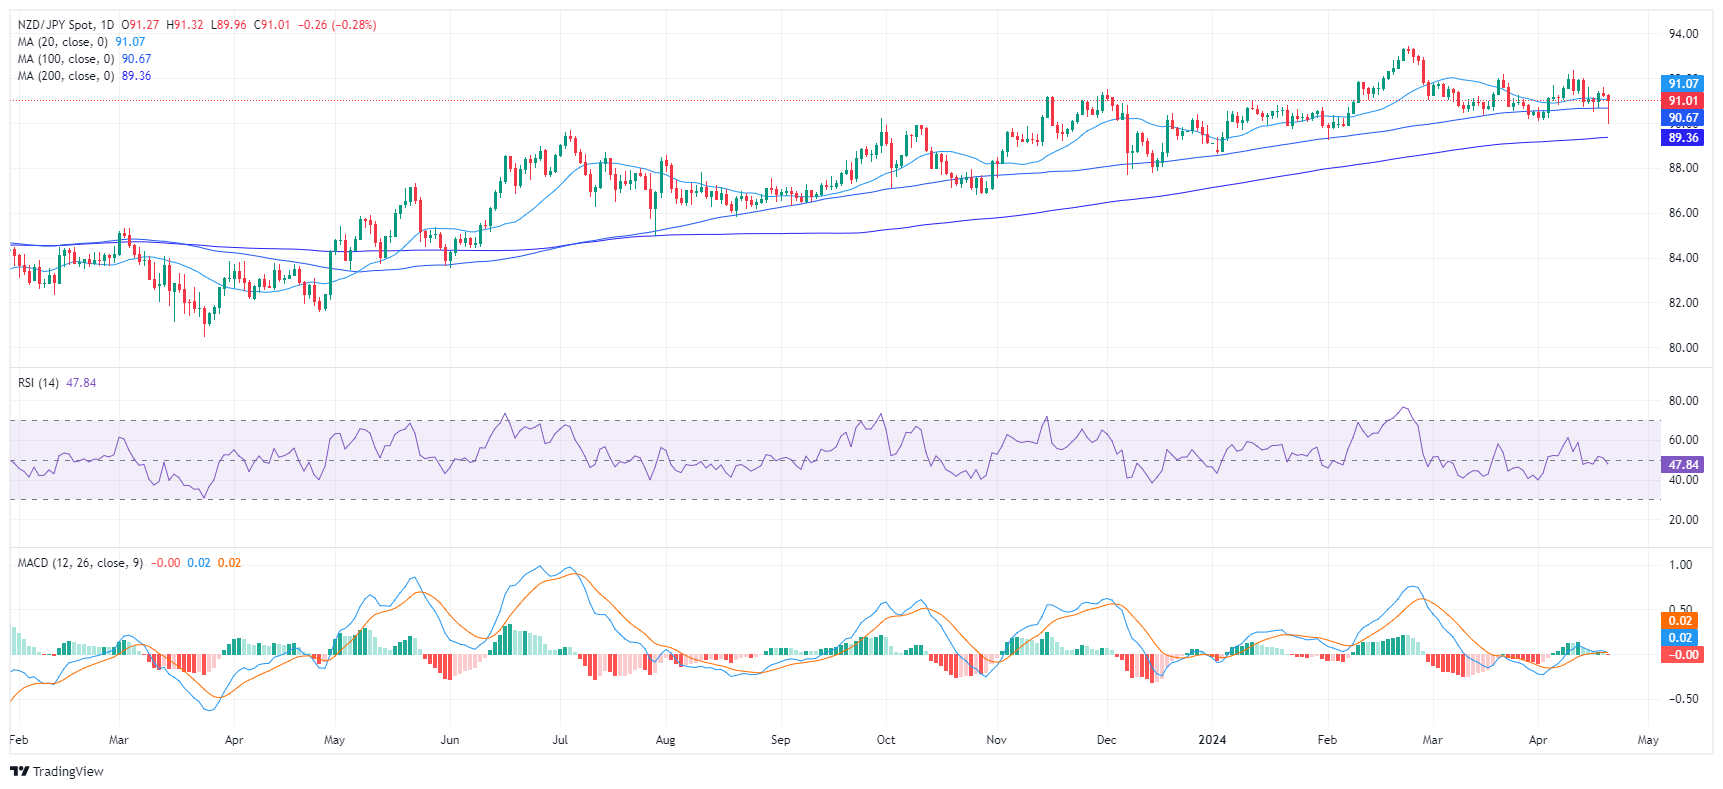
The NZD/JPY declined to 91.00, down by 0.27% on Friday. Bears are quietly gaining ground conquering the 20-day Simple Moving Average (SMA) and the selling traction is mounting. On the broader outlook, the trend is still bullish.

On the daily chart, the Relative Strength Index (RSI) pair reveals a recent drift into negative territory towards 47, indicating weakening momentum. Likewise, the Moving Average Convergence Divergence (MACD) paints a similar picture with a fresh red bar, signaling a growing bearish momentum. These indicators collectively imply sellers' dominance in the current market scenario.

NZD/JPY daily chart
Upon examining the hourly chart, the RSI stands below its middle points, also adding arguments for a negative short-term outlook. In addition, the MACD histogram is printing decreasing green bars a clear indication of diminishing bullish momentum.

NZD/JPY hourly chart
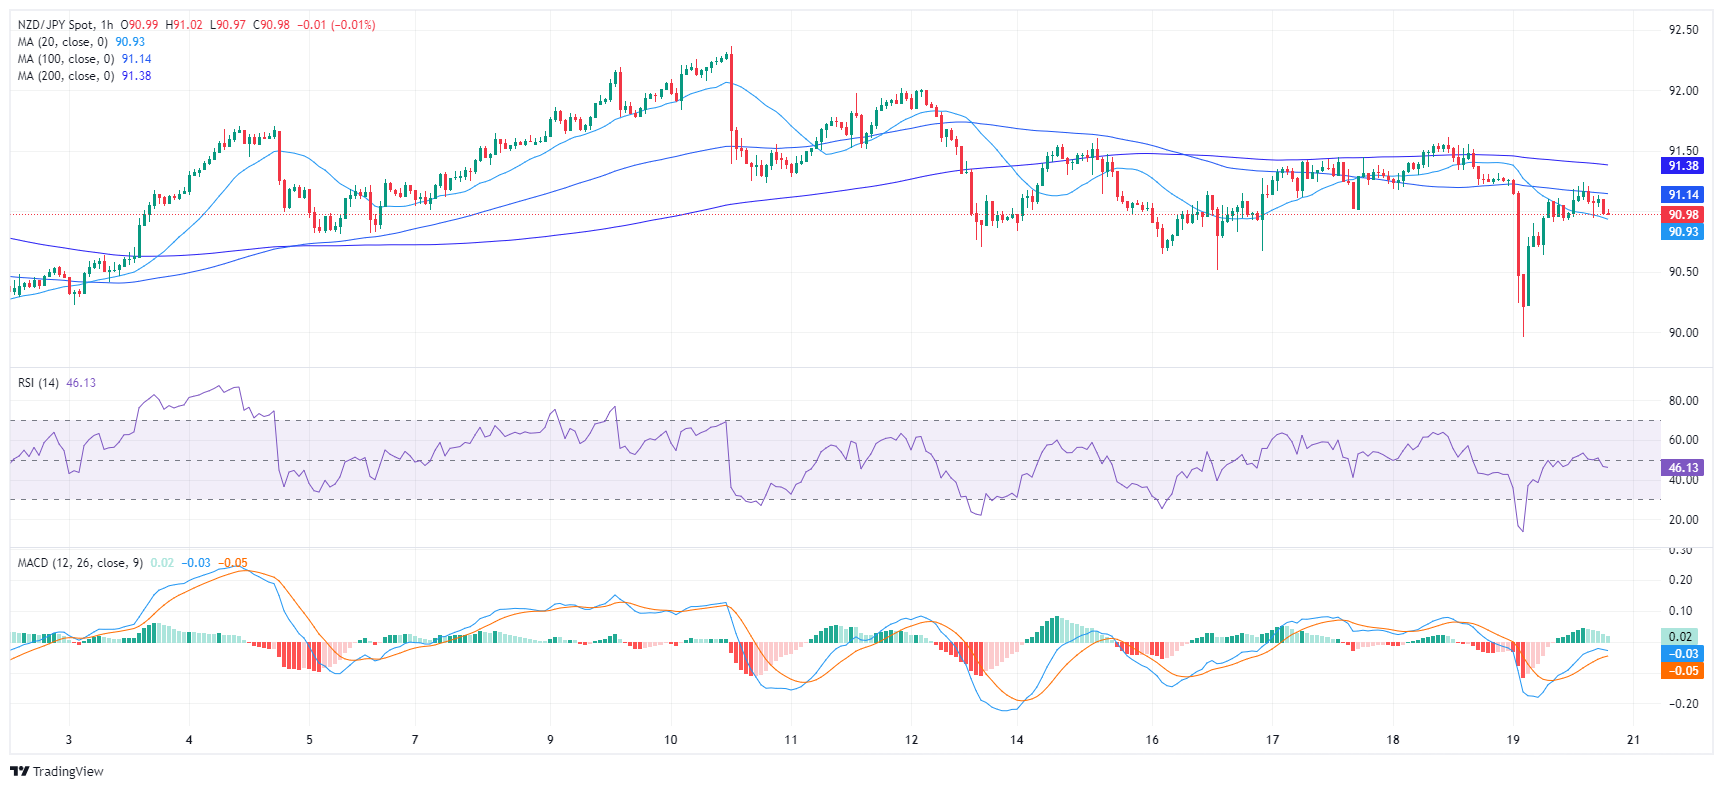
When turning the lens to the broader landscape, NZD/JPY underwent substantial changes on Friday. The pair sunk beneath the 20-day Simple Moving Average (SMA), a significant short-term technical indicator, thus potentially establishing a bearish outlook in the immediate future. Despite this, the pair has managed to maintain its position above the 100-day and 200-day SMAs, revealing sustained bullish momentum over a more extended period. That being said, as bears gather ground, they might make a stride toward the 100-day SMA at around 90.60 which in case of conquering it, would worsen the outlook for the pair.


NZD/JPY

Overview
Today last price 90.99
Today Daily Change -0.28
Today Daily Change % -0.31
Today daily open 91.27
 
Trends
Daily SMA20 91.05
Daily SMA50 91.44
Daily SMA100 90.67
Daily SMA200 89.35
 
Levels
Previous Daily High 91.62
Previous Daily Low 91.18
Previous Weekly High 92.37
Previous Weekly Low 90.7
Previous Monthly High 92.2
Previous Monthly Low 90.17
Daily Fibonacci 38.2% 91.35
Daily Fibonacci 61.8% 91.45
Daily Pivot Point S1 91.09
Daily Pivot Point S2 90.92
Daily Pivot Point S3 90.66
Daily Pivot Point R1 91.53
Daily Pivot Point R2 91.79
Daily Pivot Point R3 91.96


Disclaimer: For information purposes only. Past performance is not indicative of future results.
placeholder
Natural Gas sinks to pivotal level as China’s demand slumpsNatural Gas price (XNG/USD) edges lower and sinks to $2.56 on Monday, extending its losing streak for the fifth day in a row. The move comes on the back of China cutting its Liquified Natural Gas (LNG) imports after prices rose above $3.0 in June. It
Author  FXStreet
Jul 01, 2024
Natural Gas price (XNG/USD) edges lower and sinks to $2.56 on Monday, extending its losing streak for the fifth day in a row. The move comes on the back of China cutting its Liquified Natural Gas (LNG) imports after prices rose above $3.0 in June. It
placeholder
Bitcoin ETF Inflows For 2025 Now Outpace 2024, Data ShowsUS Bitcoin spot exchange-traded funds (ETFs) have seen more inflows this year so far compared to the same point in 2024, according to data.
Author  Bitcoinist
Jul 16, Wed
US Bitcoin spot exchange-traded funds (ETFs) have seen more inflows this year so far compared to the same point in 2024, according to data.
placeholder
Gold Price Forecast: XAU/USD gains momentum to near $3,650, eyes on US CPI releaseThe Gold price (XAU/USD) gains momentum to near $3,645 during the early Asian session on Thursday.
Author  FXStreet
Sep 11, Thu
The Gold price (XAU/USD) gains momentum to near $3,645 during the early Asian session on Thursday.
placeholder
Silver price moves above $47.50 as safe-haven demand increasesSilver price (XAG/USD) halts its three-day losing streak, trading around $47.60 per troy ounce during the Asian hours on Wednesday.
Author  FXStreet
Yesterday 07: 04
Silver price (XAG/USD) halts its three-day losing streak, trading around $47.60 per troy ounce during the Asian hours on Wednesday.
placeholder
Dogecoin Price Forecast: DOGE steadies amid declining retail interest, bearish on-chain signalsBoth the on-chain and derivatives data suggest weak sentiment among retail and long-term holders.
Author  FXStreet
Yesterday 09: 39
Both the on-chain and derivatives data suggest weak sentiment among retail and long-term holders.
Related Instrument
goTop
quote