CFDs are complex instruments and come with a high risk of losing money rapidly due to leverage. You should consider whether you understand how CFDs work and whether you can afford to take the high risk of losing your money.
    Mitrade Insights is dedicated to providing investors with rich, timely and most valuable financial information to help investors grasp the market situation and find timely trading opportunities.
    2021
    Best News & Analysis Provider
    FxDailyInfo
    2022
    Best Forex Educational Resources Global
    International Business Magazine

    GBP/JPY Price Analysis: Stalls in narrow range above the 192.00 threshold

    Source Fxstreet
    Apr 18, 2024 20:38
    • GBP/JPY slightly rises, within a 191.90/192.80 trading range.
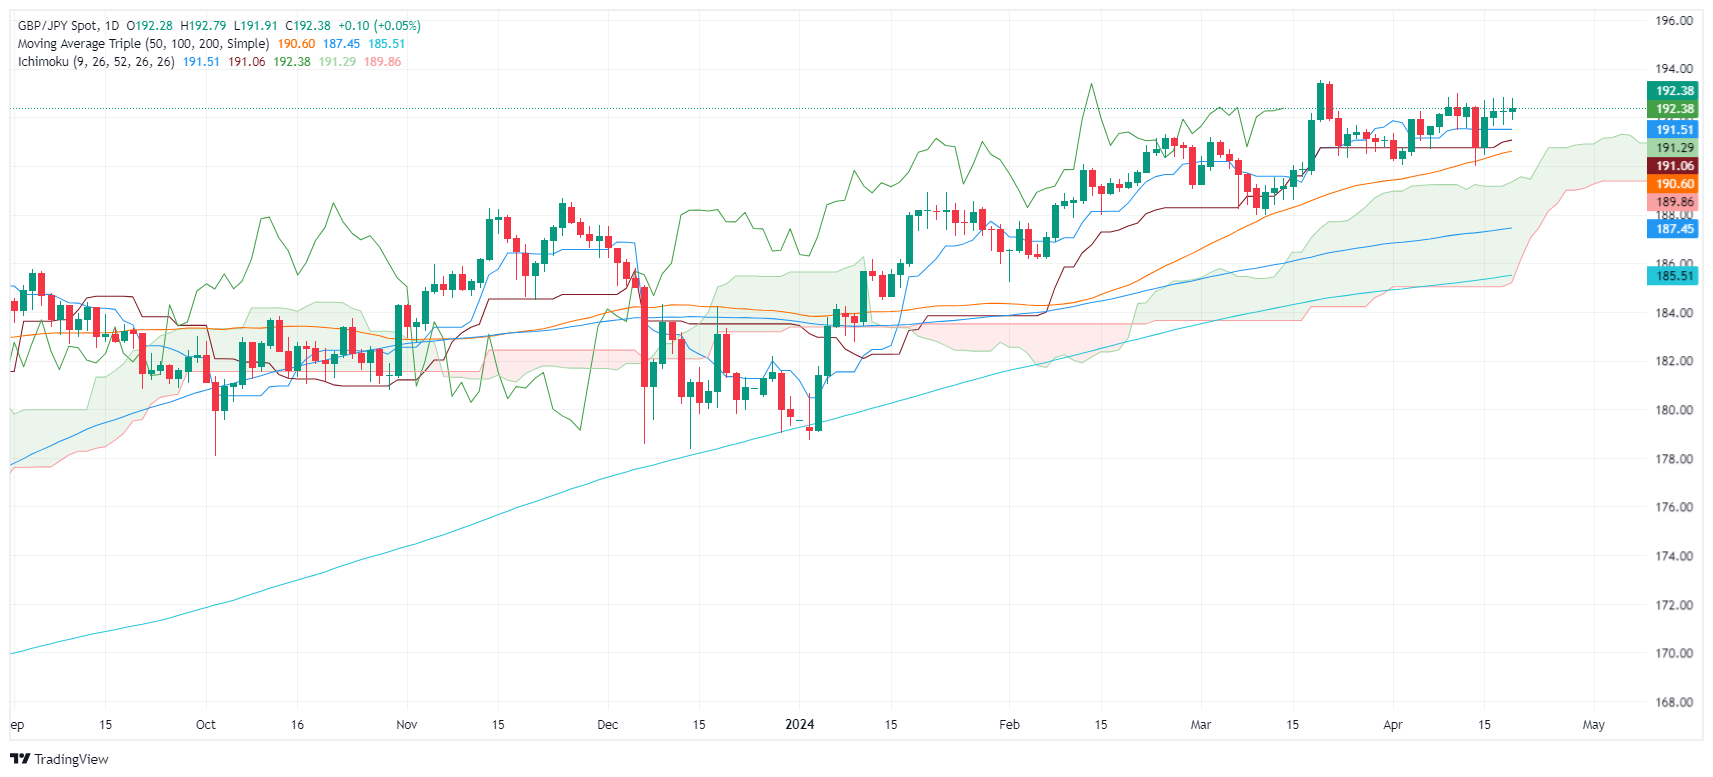
    • Positioned above the Ichimoku Cloud, technical indicators favor a bullish outlook, though signs of consolidation are evident.
    • A breakout above 192.80 could lead to testing resistance at 193.00 and potentially reaching the year-to-date high of 193.54.

    The GBP/JPY is flatlined for the second consecutive day, hovering around 192.30, clocking minimal gains of 0.05%. The cross-pair remains unable to crack the 191.90/192.80 range for the third straight day amid fears of Japanese authorities' intervention.

    GBP/JPY Price Analysis: Technical outlook

    The GBP/JPY remains above the Ichimoku Cloud (Kumo), suggesting the pair is bullish. However, it is consolidating as the distance between the Senkou Span A and B shrank, the same case with the Tenkan and Kijun-Sen levels, standing beneath the price action, at 191.46 and 191.06, respectively.

    If the pair slips below 192.00, the Tenkan and Kijun Sen levels will be exposed. Further losses are seen if the cross tumbles below the confluence of an upslope support trendline and the 50-day moving average (DMA) at 190.55.

    On the flip side, a break above resistance, seen at 192.80, could signal a continuation of the uptrend. The first supply zone to challenge would be 193.00, followed by the year-to-date (YTD) high at 193.54.

    GBP/JPY Price Action – Daily Chart
    GBP/JPY

    Overview
    Today last price 192.36
    Today Daily Change 0.08
    Today Daily Change % 0.04
    Today daily open 192.28
     
    Trends
    Daily SMA20 191.55
    Daily SMA50 190.53
    Daily SMA100 187.4
    Daily SMA200 185.46
     
    Levels
    Previous Daily High 192.84
    Previous Daily Low 191.68
    Previous Weekly High 193.02
    Previous Weekly Low 190
    Previous Monthly High 193.54
    Previous Monthly Low 187.96
    Daily Fibonacci 38.2% 192.4
    Daily Fibonacci 61.8% 192.13
    Daily Pivot Point S1 191.69
    Daily Pivot Point S2 191.11
    Daily Pivot Point S3 190.53
    Daily Pivot Point R1 192.85
    Daily Pivot Point R2 193.43
    Daily Pivot Point R3 194.01


    Disclaimer: For information purposes only. Past performance is not indicative of future results.
    placeholder
    USD/CAD Price Analysis: Holds position above 1.3750 amid resurging bullish sentimentUSD/CAD trades around 1.3780 during the early European hours on Wednesday, hovering within an ascending channel on the daily chart.
    Source  Fxstreet
    USD/CAD trades around 1.3780 during the early European hours on Wednesday, hovering within an ascending channel on the daily chart.
    placeholder
    NZD/USD remains firmer around 0.5950 due to improved risk appetiteThe NZD/USD pair showed positive movement, trading around 0.5960 during the Asian session on Friday.
    Source  Fxstreet
    The NZD/USD pair showed positive movement, trading around 0.5960 during the Asian session on Friday.
    placeholder
    NZD/USD Price Analysis: Extends winning spell to 0.5960The NZD/USD pair extends its winning streak for the fourth trading session on Thursday.
    Source  Fxstreet
    The NZD/USD pair extends its winning streak for the fourth trading session on Thursday.
    goTop
    quote