NZD/USD Price Analysis: Recovery stalls near 0.5920 as US Dollar rebounds

Source Fxstreet
  • NZD/USD faces pressure while attempting to extend recovery above 0.5920 as market sentiment turns risk-averse.
  • The US Dollar rebounds amid fears that the Fed will keep interest rates higher for a longer period.
  • The RBNZ is expected to pivot to rate cuts starting in November.

The NZD/USD pair struggles to extend recovery above the immediate resistance of 0.5920 in Thursday’s early American session. The Kiwi asset faces pressure as the US Dollar rebounds after correcting as investors fear inflation in the United States economy will remain stubbornly higher. The US Dollar Index (DXY) recovers above 106.00 after correcting to 105.75.

The market sentiment turns risk-averse as investors worry about deepening Middle East tensions. The S&P 500 opens on a cautious note as Israel refuses to make a truce with Iran after meeting with foreign ministers of the United Kingdom and Germany. Israel’s Prime Minister Benjamin Netanyahu has made clear that, “their state will do everything necessary to defend itself” reported by The Times.

10-year US Treasury yields rise sharply to 4.63% as investors hope that strong US economic outlook due to tight labor market conditions and robust consumer spending. This will keep inflation persistently higher and will allow Federal Reserve (Fed) policymakers to keep interest rates higher for a longer period.

Meanwhile, traders have repriced speculation about the Reserve Bank of New Zealand (RBNZ) 's rate cuts. The central is expected to pivot to rate cuts in November as NZ inflation grew by 0.6%, as expected in the first quarter of 2024.

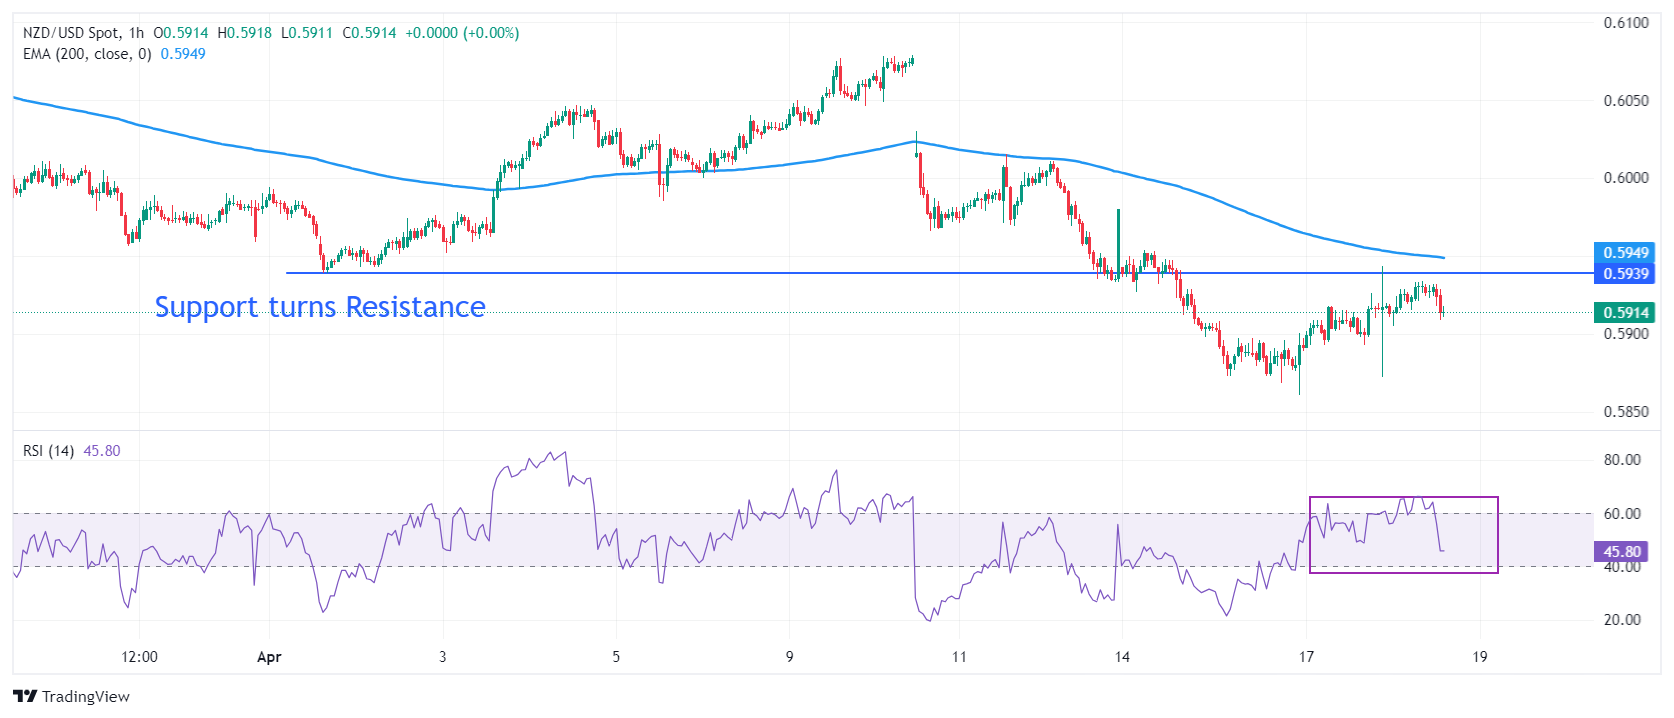
NZD/USD faces selling pressure near at April 1 low near 0.5940, which turns into a resistance for the Kiwi bulls on an hourly timeframe. The near-term outlook remains bearish as the asset trades below the 200-hour Exponential Moving Average (EMA), which trades around 0.5950.

The 14-period Relative Strength Index (RSI) drops after failing to sustain above 60.00, suggesting that sellers use the pullback to build fresh shorts.

Fresh downside would appear if the asset breaks below April 17 low at 0.5870. This would drag the asset toward 8 September 2023 low at 0.5847, followed by the round-level support of 0.5900

On the flip side, a recovery move above March 18 high at 0.6100 will drive the pair toward March 12 low at 0.6135. A breach of the latter will drive the asset further to February 9 high around 0.6160.

NZD/USD hourly chart

NZD/USD

Overview
Today last price 0.5914
Today Daily Change -0.0002
Today Daily Change % -0.03
Today daily open 0.5916
 
Trends
Daily SMA20 0.5985
Daily SMA50 0.6071
Daily SMA100 0.6129
Daily SMA200 0.606
 
Levels
Previous Daily High 0.5926
Previous Daily Low 0.586
Previous Weekly High 0.6079
Previous Weekly Low 0.5933
Previous Monthly High 0.6218
Previous Monthly Low 0.5956
Daily Fibonacci 38.2% 0.5901
Daily Fibonacci 61.8% 0.5885
Daily Pivot Point S1 0.5876
Daily Pivot Point S2 0.5835
Daily Pivot Point S3 0.581
Daily Pivot Point R1 0.5941
Daily Pivot Point R2 0.5966
Daily Pivot Point R3 0.6007


Disclaimer: For information purposes only. Past performance is not indicative of future results.
placeholder
BTC Hovers Near 60,000 Mark After Plunge. US May CPI Set to Be Revealed, How Is Wall Street Betting?Bitcoin's rebound falters as the U.S.-Iran conflict and CPI data likely sustain downward pressure.On June 10, escalating U.S.-Iran tensions put the already fragile crypto market to the te
Author  TradingKey
13 hours ago
Bitcoin's rebound falters as the U.S.-Iran conflict and CPI data likely sustain downward pressure.On June 10, escalating U.S.-Iran tensions put the already fragile crypto market to the te
placeholder
Gold plummets below $4,200 as US‑Iran tensions spur hawkish rate bets ahead of US CPIGold (XAU/USD) extends the recent breakdown momentum below a technically significant 200-day Simple Moving Average (SMA) and drops to a fresh low since March 23, further below the $4,200 mark during the Asian session on Wednesday.
Author  FXStreet
15 hours ago
Gold (XAU/USD) extends the recent breakdown momentum below a technically significant 200-day Simple Moving Average (SMA) and drops to a fresh low since March 23, further below the $4,200 mark during the Asian session on Wednesday.
placeholder
Gold Prices Fall for Four Consecutive Months, Has the Precious Metals Bull Market Partially Ended? Where Is the Next Support Level?Gold Prices ( XAUUSD) Slump for Four Consecutive Months: Has the Precious Metals Bull Market Partially Ended? Where Is the Next Support Level?Year-to-date, international gold prices have
Author  TradingKey
16 hours ago
Gold Prices ( XAUUSD) Slump for Four Consecutive Months: Has the Precious Metals Bull Market Partially Ended? Where Is the Next Support Level?Year-to-date, international gold prices have
placeholder
WTI steadies around $87.50 despite renewed supply concernsWest Texas Intermediate (WTI) oil price experiences volatility after registering over 2.5% losses in the previous day, trading around $87.40 per barrel during the Asian hours on Wednesday.
Author  FXStreet
22 hours ago
West Texas Intermediate (WTI) oil price experiences volatility after registering over 2.5% losses in the previous day, trading around $87.40 per barrel during the Asian hours on Wednesday.
placeholder
US May CPI Preview: Rising Inflation May Push Up Fed Rate Hike Expectations, How Will US Stocks, Dollar, Gold React? The U.S. Bureau of Labor Statistics will release May CPI data at 8:30 AM ET on June 10. This report is the most critical inflation reading ahead of the Federal Reserve's policy meeting on
Author  TradingKey
Yesterday 09: 55
The U.S. Bureau of Labor Statistics will release May CPI data at 8:30 AM ET on June 10. This report is the most critical inflation reading ahead of the Federal Reserve's policy meeting on
Related Instrument
goTop
quote