USD/JPY Price Analysis: Dominant uptrend continues

Source Fxstreet
  • USD/JPY extends its uptrend into the 154.00s. 
  • It may be forming a Measured Move pattern with an end target of 156.11. 
  • RSI is overbought, however, warning a correction may be on the horizon. 

USD/JPY is trading in the upper 154.00s. It has formed what looks like a Measured Move price pattern composed of three waves, commonly labeled A, B and C. 

In the case of Measured Moves, the end of wave C can be reliably predicted because it is often at the point where wave C is equal in length to wave A, or a Fibonacci ratio of wave A. At the very least wave C normally extends to a 0.618 ratio of A. 

USD/JPY Daily Chart

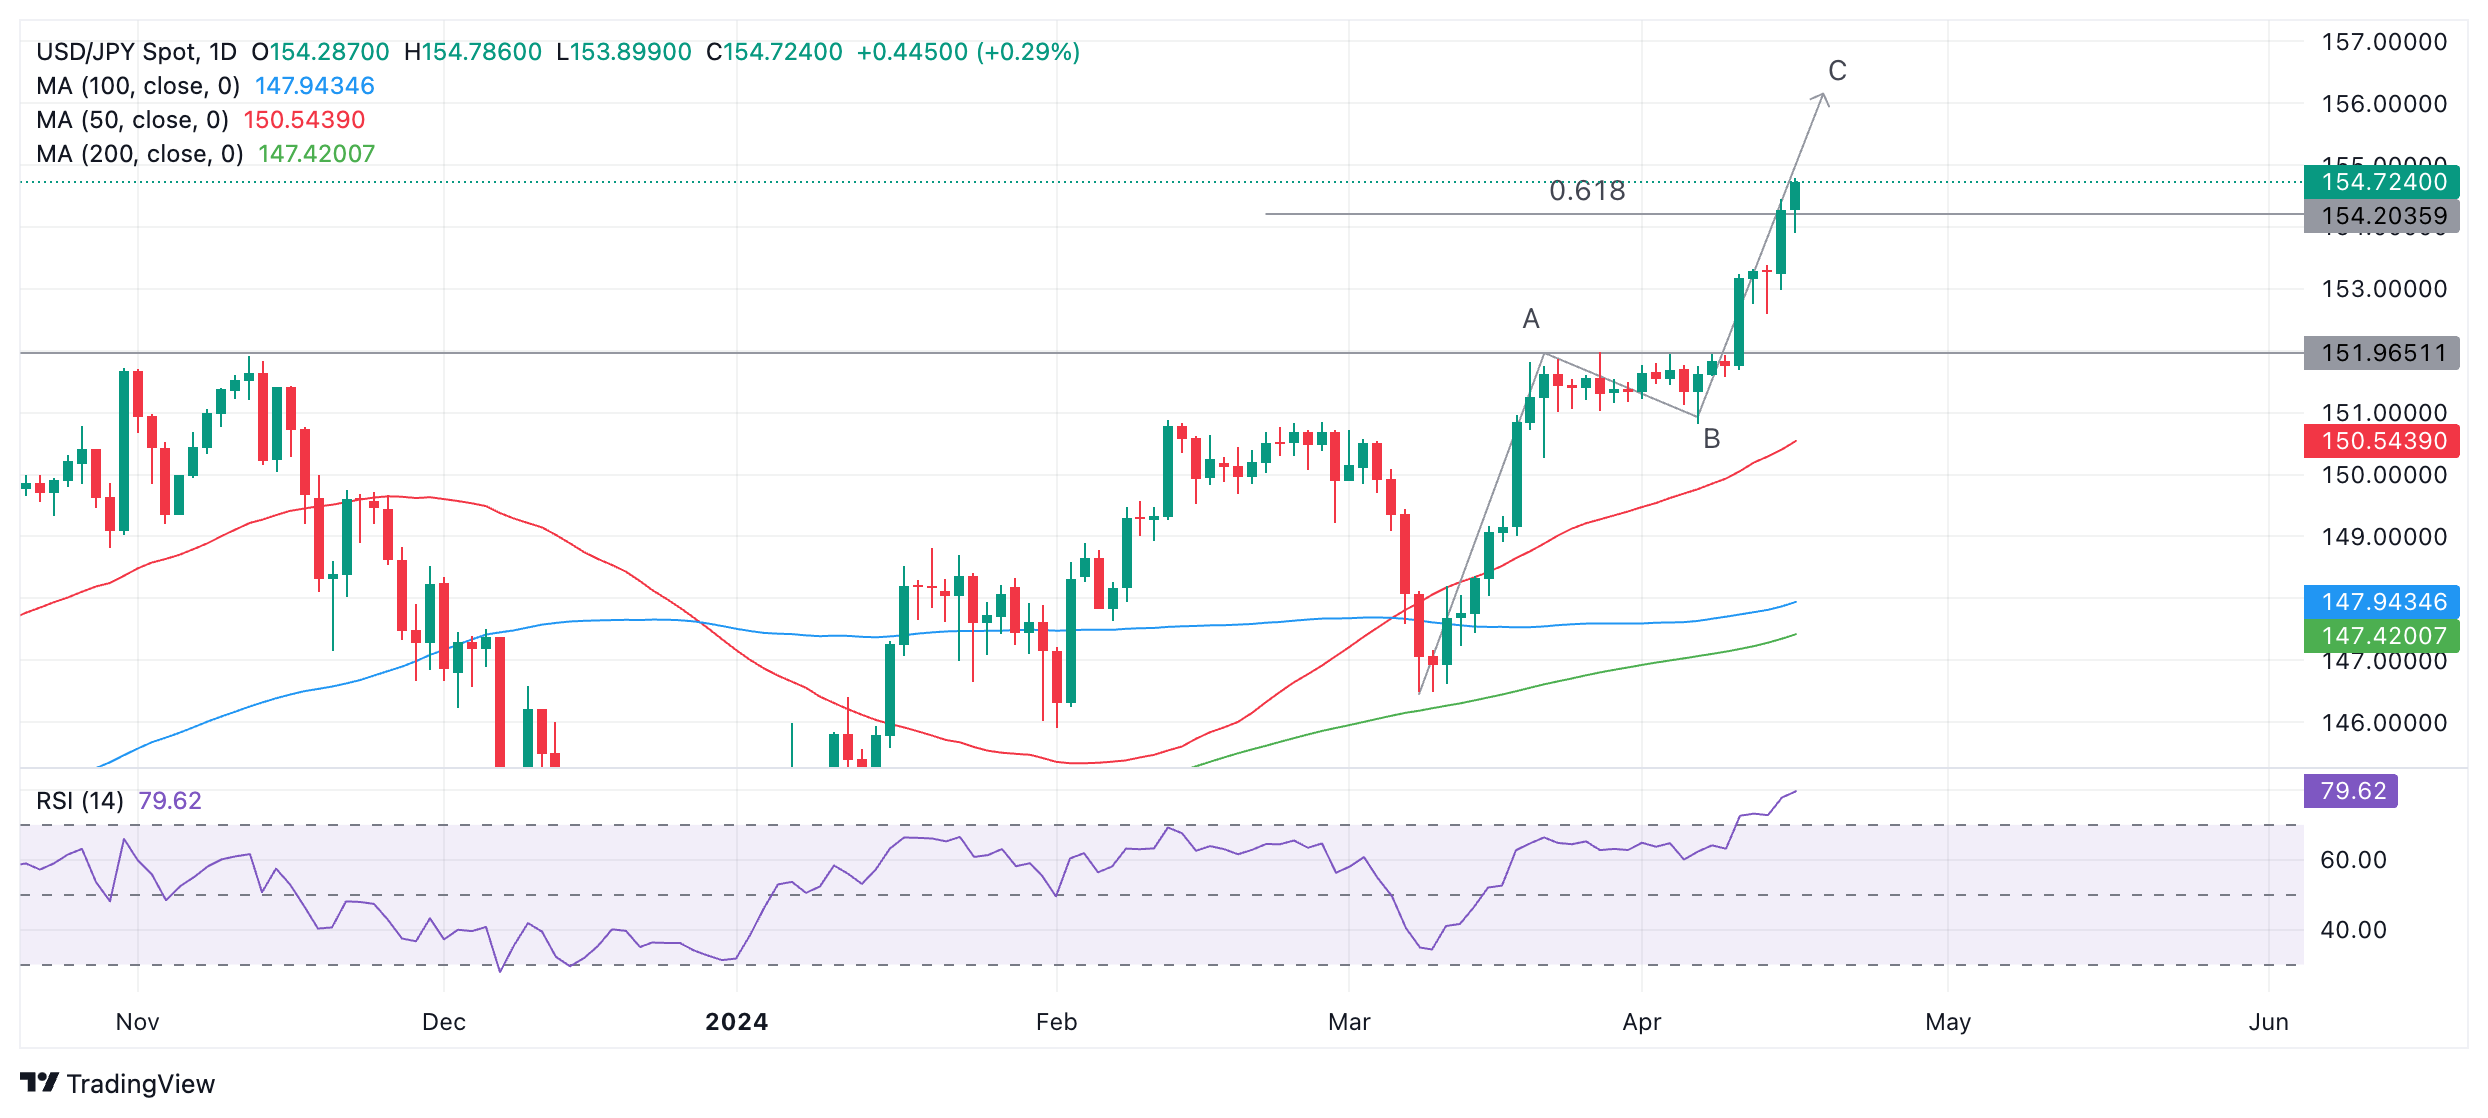
The end of C if it ends equal to A it will reach roughly 156.11 and there is a chance the rally could extend that high. 

However, it is also the case that price has already reached the conservative target for the end of wave C at the Fib. 0.618 extension of A, at 154.20, which means there is a possibility it may have unfolded to its limit. 

In addition, the Relative Strength Index (RSI) is well into overbought territory, recommending bullish traders with a medium-term outlook should not increase their long bets. If RSI exits overbought it may be a sign USD/JPY is pulling back. 

For USD/JPY bulls the important thing is that price itself continues to rise and as long as it does the uptrend is likely to continue.


Disclaimer: For information purposes only. Past performance is not indicative of future results.
placeholder
Bitcoin Suffers Year’s Strongest Waterfall-Style Decline. Will It Next Drop to the $60,000 Mark?During the Asian trading session on June 4, Bitcoin continued its multi-day slump, briefly dropping below the $62,000 mark to $61,338. As of press time, Bitcoin was trading at $63,844, wi
Author  TradingKey
13 hours ago
During the Asian trading session on June 4, Bitcoin continued its multi-day slump, briefly dropping below the $62,000 mark to $61,338. As of press time, Bitcoin was trading at $63,844, wi
placeholder
Bitcoin drops below $65K amid reinforced bear market signalsBitcoin (BTC) dipped further below $65,000 on Wednesday, with onchain data from Glassnode signaling a market firmly in a bear phase. The decline has pushed prices back into a key valuation range between the Realized Price and the True Market Mean.
Author  FXStreet
22 hours ago
Bitcoin (BTC) dipped further below $65,000 on Wednesday, with onchain data from Glassnode signaling a market firmly in a bear phase. The decline has pushed prices back into a key valuation range between the Realized Price and the True Market Mean.
placeholder
Forex Today: US Dollar stays resilient ahead of key US dataHere is what you need to know on Wednesday, June 3:
Author  FXStreet
Yesterday 10: 27
Here is what you need to know on Wednesday, June 3:
placeholder
$1.5 Billion in Crypto Assets Liquidated, Bitcoin Falls Below $66,000 Mark. What Is the Reason?On June 2, Eastern Time, the cryptocurrency market suffered its most severe wave of concentrated liquidations so far this year. Bitcoin ( BTC) fell below the $70,000 psychological support
Author  TradingKey
Yesterday 06: 32
On June 2, Eastern Time, the cryptocurrency market suffered its most severe wave of concentrated liquidations so far this year. Bitcoin ( BTC) fell below the $70,000 psychological support
placeholder
WTI rises to near $93.00 as Iran launches missiles toward Kuwait, BahrainWest Texas Intermediate (WTI) gains ground for the third successive day, trading around $92.90 per barrel during the Asian hours on Wednesday.
Author  FXStreet
Yesterday 01: 24
West Texas Intermediate (WTI) gains ground for the third successive day, trading around $92.90 per barrel during the Asian hours on Wednesday.
Related Instrument
goTop
quote