


Canadian Dollar hits fresh five-month lows after mixed inflation data
- Canadian Dollar depreciates further after mixed Canadian inflation data.
- Core CPI eases to 2% YoY in March, feeding hopes that BoC might start cutting rates in June.
- Later Tuesday, Fed Chair Powell and BoC President Macklem will speak about Canadian economy in Washington.
The Canadian Dollar (CAD) is going through a sharp depreciation against a stronger Greenback on Tuesday, and the mixed Canadian Consumer Prices Index (CPI) has failed to provide any significant support. Consumer inflation accelerated in March although the Core Bank of Canada CPI rose at a slower pace than in the previous month.
These figures come in line with cooling inflationary trends last seen at the Bank of Canada’s most recent monetary policy meeting, which would allow them to start cutting rates in June. This explains the negative impact on the Canadian Dollar vis-à-vis the Greenback.
Later Tuesday, BoC Governor Tiff Macklem and Federal Reserve (Fed) Chair Jerome Powell are expected to take part in a panel discussion about the Canadian economy in Washington. Any comments about the monetary policy plans of their respective banks are likely to be analyzed with particular interest.
Daily digest market movers: USD/CAD rallies further on monetary policy divergence
- Lower hopes of Fed easing in the coming months and then higher expectations that the BoC will trim rates in June are hammering the Canadian Dollar.
- Canadian CPI accelerated at a 0.6% pace in March and 2.9% YoY, up from 0.3% and 2.8% in the previous month.
- Core CPI, however, eased to a 2.0% yearly rate from 2.1% over the previous month.
- US Construction activity data has disappointed, with Housing Starts and Building Permits declining beyond expectations in March.
- US Industrial Production grew 0.4% in March, in line with market expectations and unchanged from the previous month. Capacity utilization increased to 78.4% from the downwardly revised 78.2% but below the 78.5% forecasted by experts.
- Fed Vice Chair Jefferson has given a neutral speech hinting at rate cuts later this year but also warning that inflation data forces it to keep rates high for a longer time.
Canadian Dollar price this week
The table below shows the percentage change of Canadian Dollar (CAD) against listed major currencies this week. Canadian Dollar was the weakest against the Swiss Franc.
| USD | EUR | GBP | CAD | AUD | JPY | NZD | CHF | |
| USD | 0.20% | 0.22% | 0.48% | 1.03% | 0.83% | 1.00% | -0.10% | |
| EUR | -0.19% | 0.02% | 0.26% | 0.83% | 0.63% | 0.81% | -0.32% | |
| GBP | -0.21% | -0.02% | 0.27% | 0.82% | 0.62% | 0.79% | -0.32% | |
| CAD | -0.48% | -0.29% | -0.27% | 0.56% | 0.35% | 0.52% | -0.60% | |
| AUD | -1.05% | -0.85% | -0.84% | -0.56% | -0.21% | -0.03% | -1.16% | |
| JPY | -0.82% | -0.61% | -0.58% | -0.35% | 0.20% | 0.23% | -0.94% | |
| NZD | -0.99% | -0.84% | -0.82% | -0.52% | 0.03% | -0.17% | -1.12% | |
| CHF | 0.12% | 0.31% | 0.34% | 0.60% | 1.15% | 0.95% | 1.12% |
The heat map shows percentage changes of major currencies against each other. The base currency is picked from the left column, while the quote currency is picked from the top row. For example, if you pick the Euro from the left column and move along the horizontal line to the Japanese Yen, the percentage change displayed in the box will represent EUR (base)/JPY (quote).
Technical analysis: USD/CAD reaches overbought levels at 1.3845
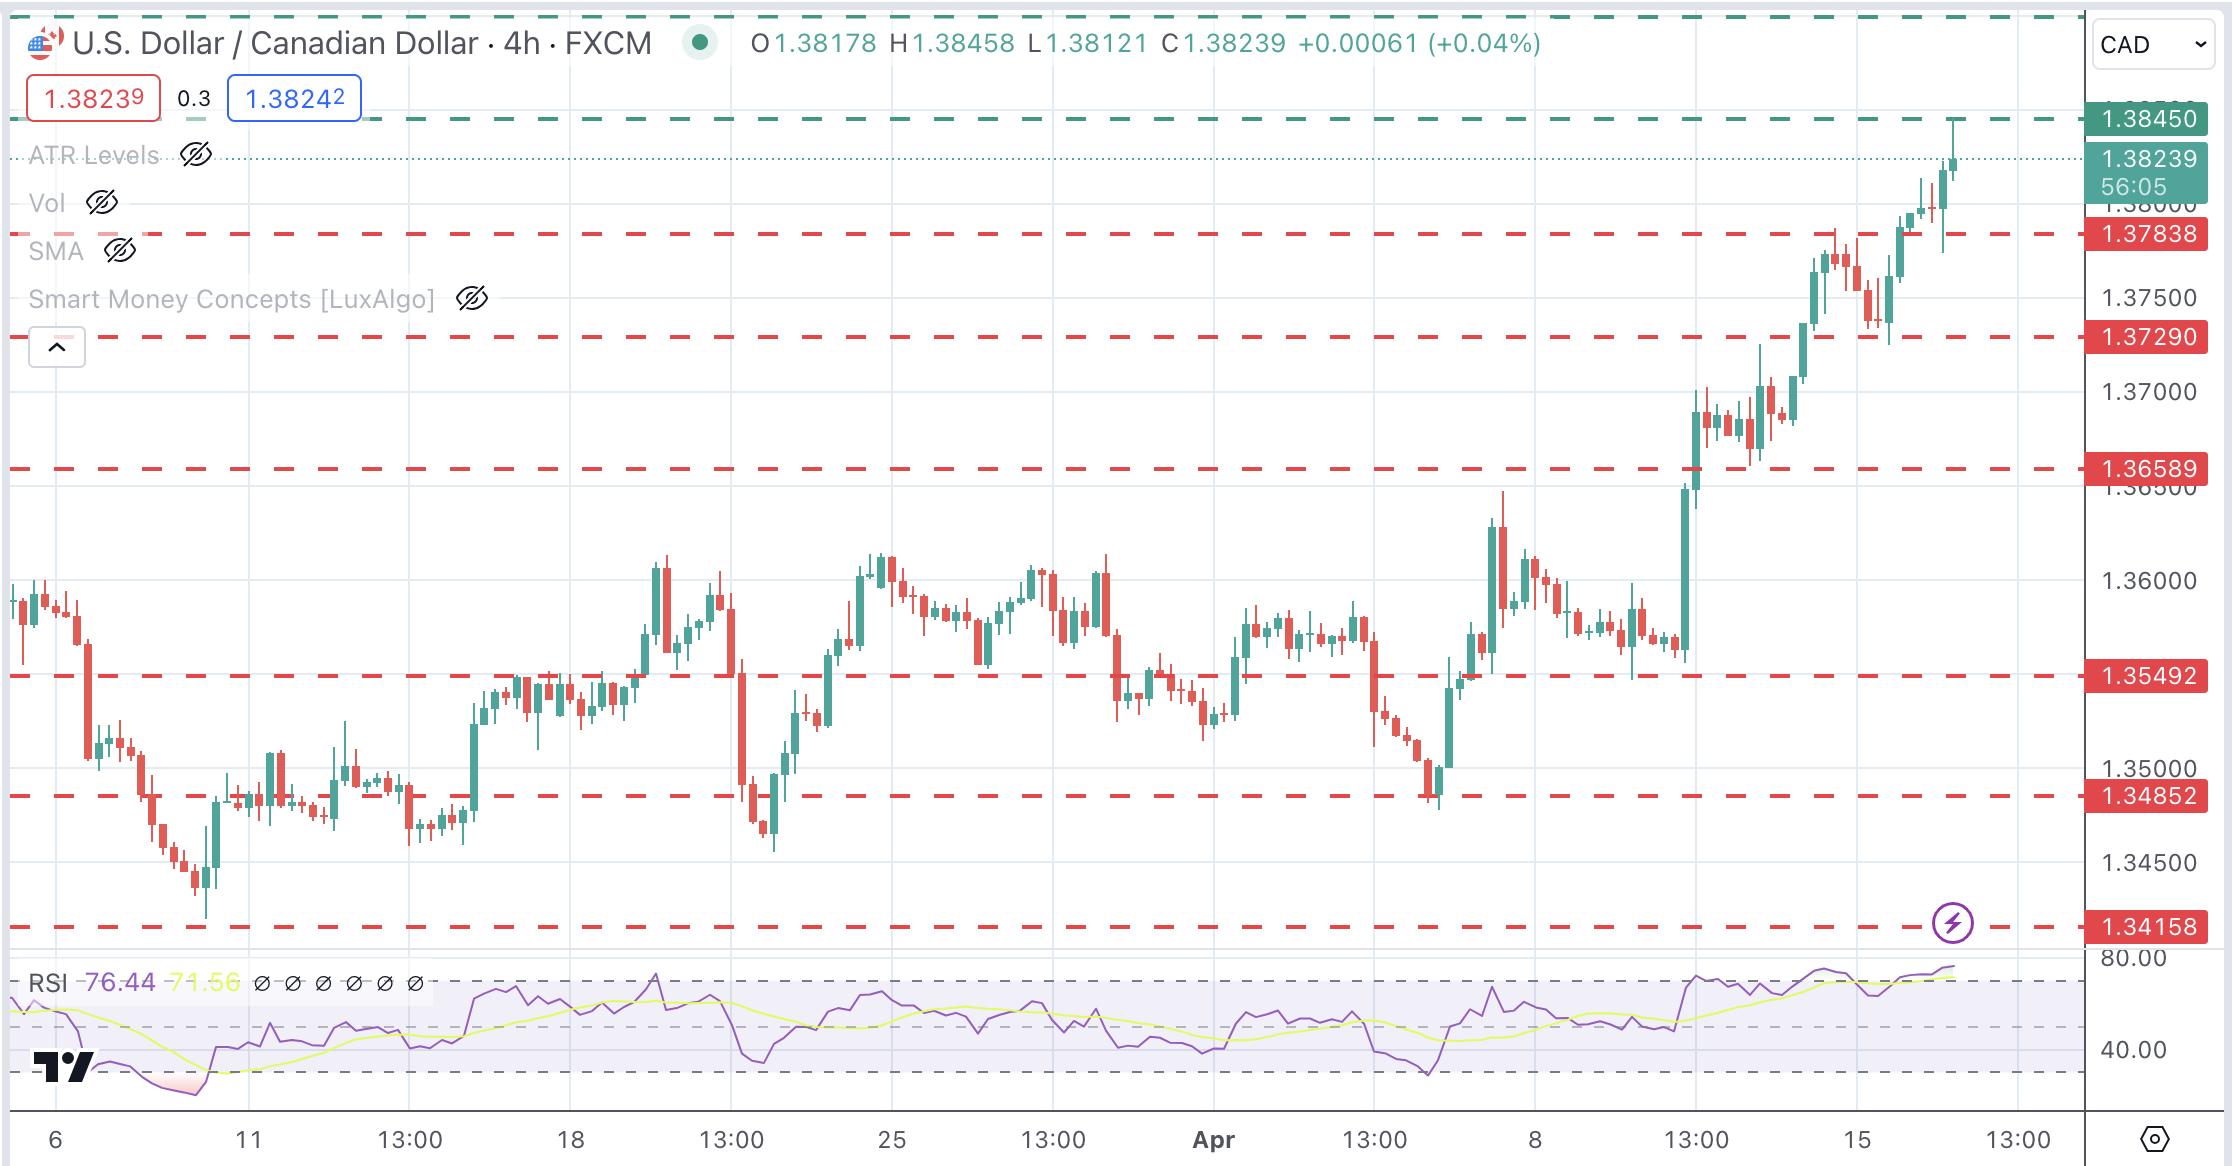
The US Dollar seems unstoppable. The pair has rallied non-stop during the last six trading days, appreciating nearly 2%. RSI levels are at overbought territory, although with no sign of a reversal in sight.
Bulls have hit resistance at the 1.3845 area, and these conditions suggest the possibility of a bearish correction. In that case, 1.3785 and 1.3730 are likely to provide support. On the upside, above 1.3845, the next target is the November 2023 high at 1.3900.
USD/CAD 4-Hour Chart
Central banks FAQs
Central Banks have a key mandate which is making sure that there is price stability in a country or region. Economies are constantly facing inflation or deflation when prices for certain goods and services are fluctuating. Constant rising prices for the same goods means inflation, constant lowered prices for the same goods means deflation. It is the task of the central bank to keep the demand in line by tweaking its policy rate. For the biggest central banks like the US Federal Reserve (Fed), the European Central Bank (ECB) or the Bank of England (BoE), the mandate is to keep inflation close to 2%.
A central bank has one important tool at its disposal to get inflation higher or lower, and that is by tweaking its benchmark policy rate, commonly known as interest rate. On pre-communicated moments, the central bank will issue a statement with its policy rate and provide additional reasoning on why it is either remaining or changing (cutting or hiking) it. Local banks will adjust their savings and lending rates accordingly, which in turn will make it either harder or easier for people to earn on their savings or for companies to take out loans and make investments in their businesses. When the central bank hikes interest rates substantially, this is called monetary tightening. When it is cutting its benchmark rate, it is called monetary easing.
A central bank is often politically independent. Members of the central bank policy board are passing through a series of panels and hearings before being appointed to a policy board seat. Each member in that board often has a certain conviction on how the central bank should control inflation and the subsequent monetary policy. Members that want a very loose monetary policy, with low rates and cheap lending, to boost the economy substantially while being content to see inflation slightly above 2%, are called ‘doves’. Members that rather want to see higher rates to reward savings and want to keep a lit on inflation at all time are called ‘hawks’ and will not rest until inflation is at or just below 2%.
Normally, there is a chairman or president who leads each meeting, needs to create a consensus between the hawks or doves and has his or her final say when it would come down to a vote split to avoid a 50-50 tie on whether the current policy should be adjusted. The chairman will deliver speeches which often can be followed live, where the current monetary stance and outlook is being communicated. A central bank will try to push forward its monetary policy without triggering violent swings in rates, equities, or its currency. All members of the central bank will channel their stance toward the markets in advance of a policy meeting event. A few days before a policy meeting takes place until the new policy has been communicated, members are forbidden to talk publicly. This is called the blackout period.
Recommended Articles


