

GBP/USD steadies near 1.3200 as traders bet on dual Fed–BoE dovish pivot
- GBP/USD holds steady as ISM Manufacturing contraction reinforces expectations of a December Fed cut.
- FedWatch prices 87% odds of a 25-bps cut despite rising Treasury yields and a flat DXY.
- UK political uncertainty grows after OBR chief resigns, with markets assigning 90% odds of a BoE cut.
GBP/USD holds steady near 1.3200 as the Dollar registers minimal gains although the US economy continues to show signs of weakness, which could prompt the Federal Reserve to ease policy in the December meeting.
Sterling steady despite soft UK outlook, as rising odds of a December Fed cut dominate market sentiment
On Monday, the Institute for Supply Management (ISM) revealed that manufacturing activity shrank by the nine consecutive months. The ISM Manufacturing PMI in November missed estimates, fell from 48.7 to 48.2, missing forecasts of 49. Also, the sub-component of employment reaffirmed the low-firing, low-hiring environment, exerting pressure on the Fed to cut rates.
Expectations for a 25-basis points rate cut by the Fed are 87% up from a month ago 63% odds, revealed the CME FedWatch Tool.
The US Dollar Index (DXY), which tracks the buck’s performance against a basket of six currencies, is virtually unchanged at 99.43 even though US Treasury yields are rising.
In the UK, the head of the Office for Budget Responsibility (OBR) resigned, after the Autumn Budget presented by Chancellor Rachel Reeves, was published ahead of the announcement at the parliament.
On Tuesday the OECD revealed its forecasts for the UK economy, which is expected to grow faster than previously expected, in 2026. Economic data showed that UK’s house prices increased faster than expected in November.
Despite this, the Bank of England is expected to cut rates at the December meeting, with money markets pricing in a 90% chance according to LSEG data.
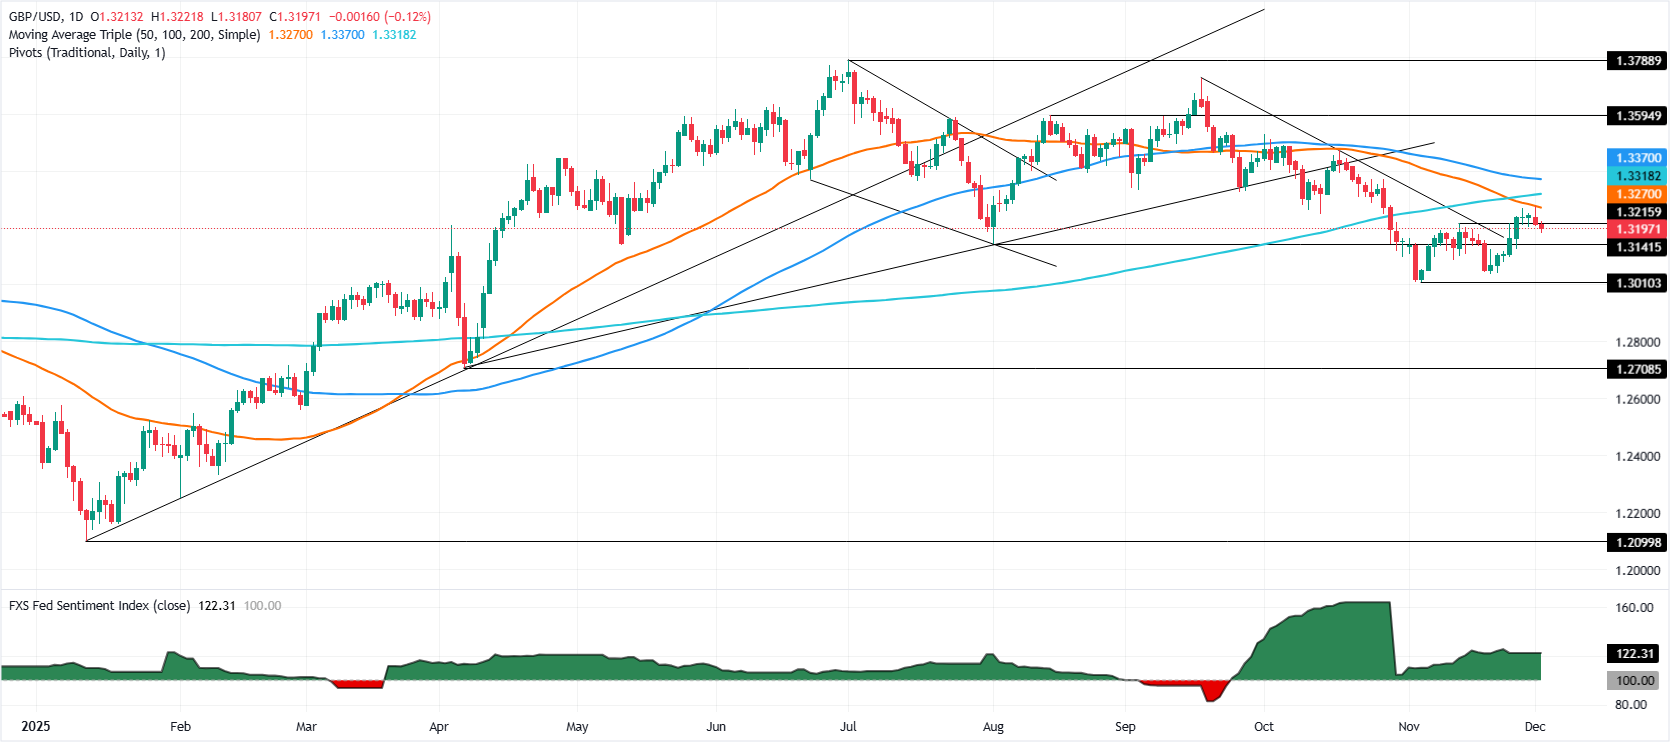
GBP/USD Price Forecast: Technical outlook
The GBP/USD remains subdued capped on the upside by the 50-day SMA at 1.3267. Momentum is also flattish as the Relative Strength Index (RSI) meanders near the 50 neutral line. For a bullish resumption, traders need to clear the 50-day SMA and the 1.3300 figure. If surpassed, they could challenge the 200-day SMA at 1.3315.
On the downside, the first key support is 1.3200. Once surpassed, the next stop is the 20-day SMA at 1.3153, ahead of 1.3100.
Pound Sterling Price This week
The table below shows the percentage change of British Pound (GBP) against listed major currencies this week. British Pound was the strongest against the Swiss Franc.
| USD | EUR | GBP | JPY | CAD | AUD | NZD | CHF | |
|---|---|---|---|---|---|---|---|---|
| USD | -0.07% | 0.30% | -0.17% | 0.02% | -0.30% | -0.10% | 0.13% | |
| EUR | 0.07% | 0.37% | -0.07% | 0.09% | -0.23% | -0.05% | 0.20% | |
| GBP | -0.30% | -0.37% | -0.19% | -0.28% | -0.59% | -0.40% | -0.17% | |
| JPY | 0.17% | 0.07% | 0.19% | 0.17% | -0.16% | 0.03% | 0.27% | |
| CAD | -0.02% | -0.09% | 0.28% | -0.17% | -0.37% | -0.12% | 0.11% | |
| AUD | 0.30% | 0.23% | 0.59% | 0.16% | 0.37% | 0.19% | 0.42% | |
| NZD | 0.10% | 0.05% | 0.40% | -0.03% | 0.12% | -0.19% | 0.24% | |
| CHF | -0.13% | -0.20% | 0.17% | -0.27% | -0.11% | -0.42% | -0.24% |
The heat map shows percentage changes of major currencies against each other. The base currency is picked from the left column, while the quote currency is picked from the top row. For example, if you pick the British Pound from the left column and move along the horizontal line to the US Dollar, the percentage change displayed in the box will represent GBP (base)/USD (quote).
Recommended Articles


