
GBP/JPY under pressure near 200.00 as double-top pattern signals downside risk
- GBP/JPY falls to a two-week low near 200.68 as the Sterling weakens amid UK fiscal concerns and rising interest rate cut expectations.
- A decisive break below 200.00 could open the way toward 198.87, filling the bullish gap from early October.
- Traders await BoJ policy decision on Thursday, with the central bank expected to keep interest rates unchanged.
The British Pound (GBP) extends its decline against the Japanese Yen (JPY) on Wednesday, with the cross falling to around 200.68 — its lowest level in two weeks — as Sterling remains under broad pressure amid fiscal concerns and growing expectations of interest rate cuts in the United Kingdom (UK).
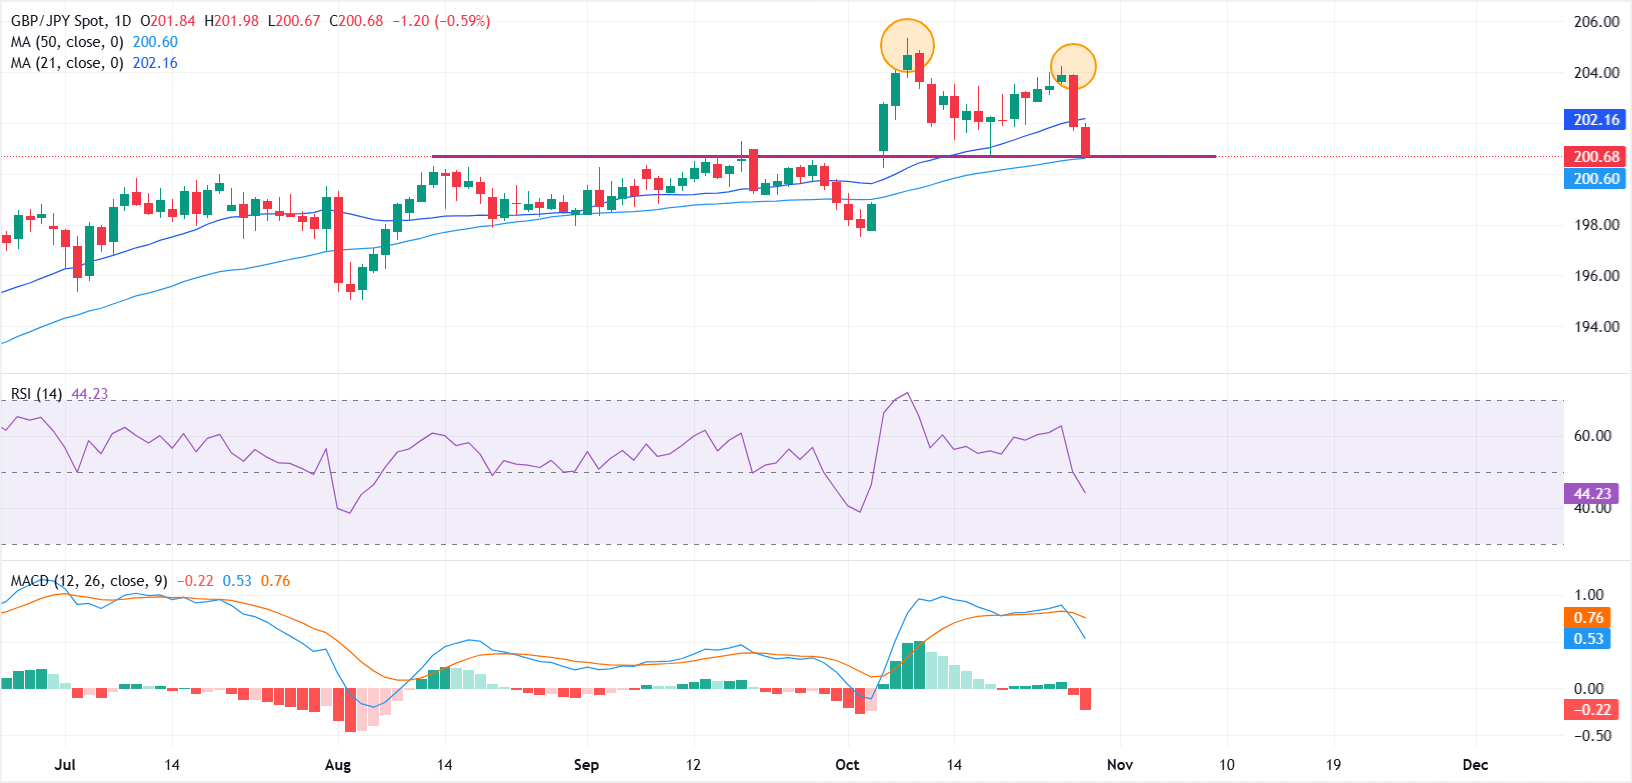
From a technical perspective, GBP/JPY is testing a critical confluence zone near the 200.00 psychological handle, which aligns with the 50-day Simple Moving Average (SMA) and a horizontal support that previously acted as resistance. The zone also coincides with the neckline of a potential double-top pattern, raising the risk of a bearish reversal if the price closes decisively below this level.
A sustained break beneath 200.00 would likely open the door for a deeper pullback toward the October 3 high at 198.87, which also aligns with an unfilled bullish gap from October 6. A daily close below that area could reinforce the downside momentum, exposing further support near 197.50.
On the upside, immediate resistance is seen around the 21-day SMA at 202.16. A recovery above this dynamic barrier could ease the bearish pressure and allow the pair to retest the 204.00 mark.
Momentum indicators reflect weakening momentum. The Relative Strength Index (RSI) sits around 44.8, signaling bearish bias, while the Moving Average Convergence Divergence (MACD) indicator shows a fresh bearish crossover, with the histogram extending into negative territory.
Looking ahead, the Bank of Japan’s (BoJ) monetary policy decision due on Thursday could trigger fresh volatility, with the central bank expected to keep rates unchanged amid Japan’s shifting fiscal outlook.
Pound Sterling Price Today
The table below shows the percentage change of British Pound (GBP) against listed major currencies today. British Pound was the strongest against the Swiss Franc.
| USD | EUR | GBP | JPY | CAD | AUD | NZD | CHF | |
|---|---|---|---|---|---|---|---|---|
| USD | 0.13% | 0.49% | -0.08% | -0.17% | -0.27% | -0.10% | 0.52% | |
| EUR | -0.13% | 0.37% | -0.19% | -0.31% | -0.40% | -0.22% | 0.39% | |
| GBP | -0.49% | -0.37% | -0.56% | -0.67% | -0.77% | -0.59% | 0.02% | |
| JPY | 0.08% | 0.19% | 0.56% | -0.12% | -0.21% | -0.02% | 0.59% | |
| CAD | 0.17% | 0.31% | 0.67% | 0.12% | -0.10% | 0.09% | 0.70% | |
| AUD | 0.27% | 0.40% | 0.77% | 0.21% | 0.10% | 0.18% | 0.80% | |
| NZD | 0.10% | 0.22% | 0.59% | 0.02% | -0.09% | -0.18% | 0.61% | |
| CHF | -0.52% | -0.39% | -0.02% | -0.59% | -0.70% | -0.80% | -0.61% |
The heat map shows percentage changes of major currencies against each other. The base currency is picked from the left column, while the quote currency is picked from the top row. For example, if you pick the British Pound from the left column and move along the horizontal line to the US Dollar, the percentage change displayed in the box will represent GBP (base)/USD (quote).
Recommended Articles


