USD/CAD Price Analysis: Channeling higher

Source Fxstreet
  • USD/CAD is steadily channeling higher on US Dollar strength. 
  • Underneath price lie the three most important Moving Averages providing a safety net. 
  • Price is marginally biased to continue rising within the bullish channel. 

USD/CAD is broadly channeling higher on the daily chart as the US Dollar (USD) steadily appreciates against the Canadian Dollar (CAD).

The range stretches from around the 1.3600s to the 1.3400s at the moment, although it is incrementally slanting higher. 

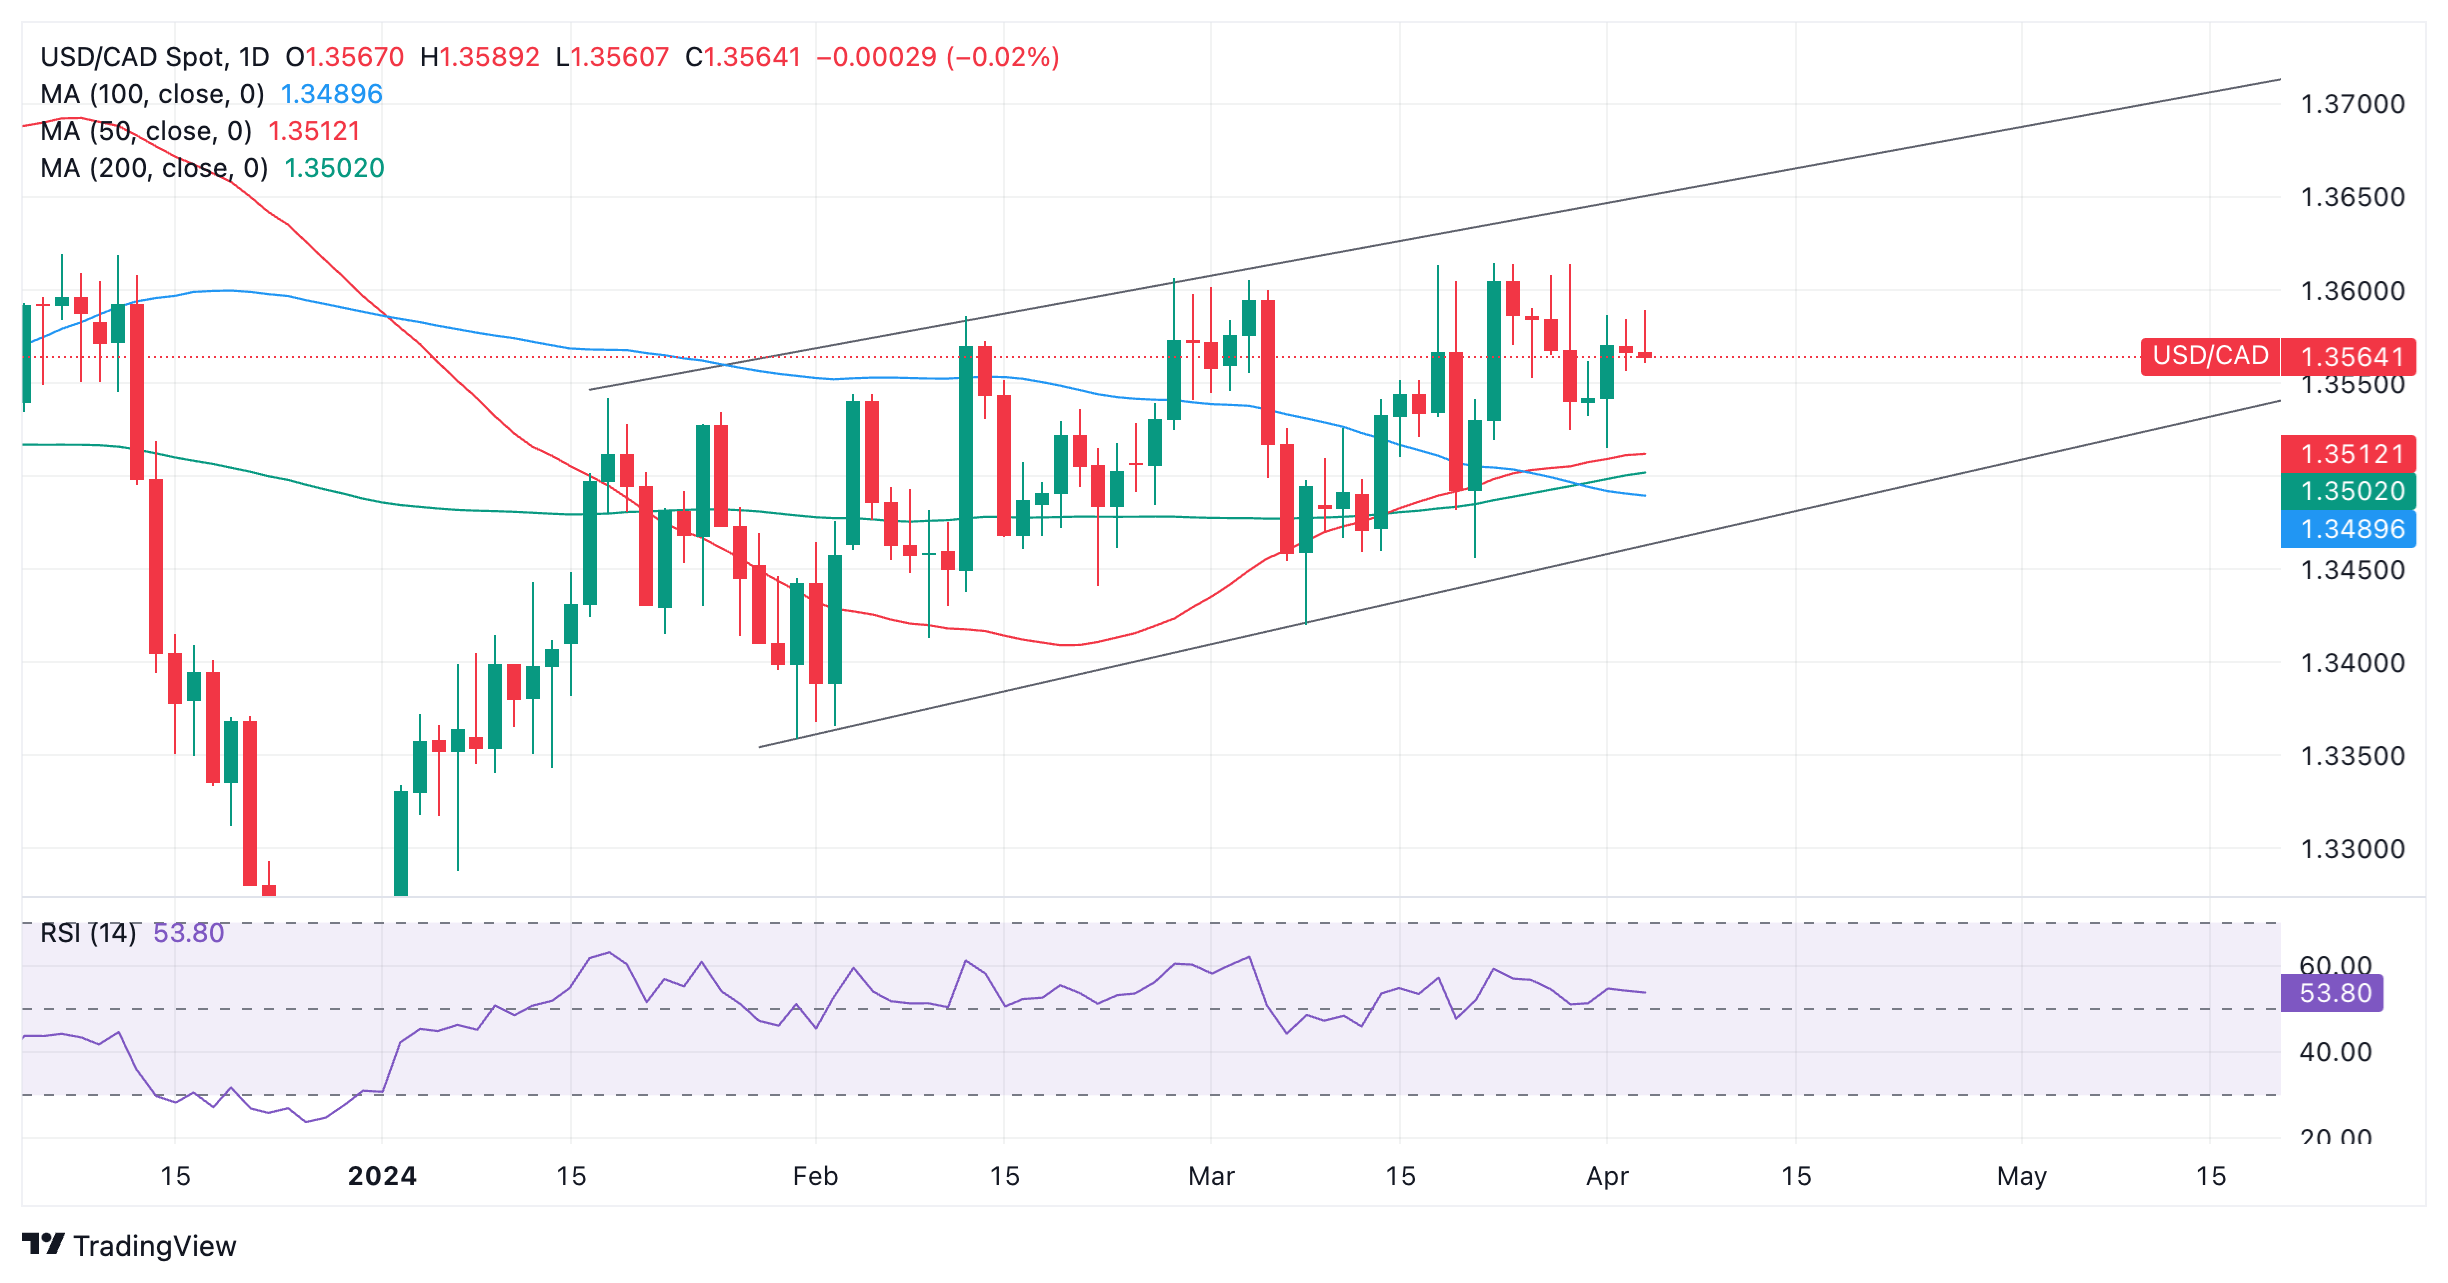
US Dollar versus Canadian Dollar: Daily chart 

USD/CAD is currently trading plum in the middle of the channel as it seesaws between tepid gains and losses. 

Given the bullish slant to the channel there is a slight but not significant bias for more upside and the pair could rise to the top of the channel at roughly 1.3675. 

Clustering just beneath price action around the 1.3500 level are the three most important Moving Averages – the 50, 100 and 200-day (Simple Moving Averages). These are key because they are not only followed by private investors but also institutional players.

Additionally, on the chart of USD/CAD it is notable how price action has respected the support cushion provided by these SMAs on several occasions during the formation of the channel. 

A move down from the current level in the mid 1.3500s will find support at the first SMA, the 50-day, at 1.3512, and probably bounce. Even if it penetrates below it is likely to find support from the 200-day SMA at 1.3502. 

If it gets through all three SMAs the bottom of the channel comes in with further support at roughly 1.3470. 


Disclaimer: For information purposes only. Past performance is not indicative of future results.
placeholder
Natural Gas sinks to pivotal level as China’s demand slumpsNatural Gas price (XNG/USD) edges lower and sinks to $2.56 on Monday, extending its losing streak for the fifth day in a row. The move comes on the back of China cutting its Liquified Natural Gas (LNG) imports after prices rose above $3.0 in June. It
Author  FXStreet
Jul 01, 2024
Natural Gas price (XNG/USD) edges lower and sinks to $2.56 on Monday, extending its losing streak for the fifth day in a row. The move comes on the back of China cutting its Liquified Natural Gas (LNG) imports after prices rose above $3.0 in June. It
placeholder
Ethereum (ETH) Price Closes Above $3,900 — Is a New All-Time High Possible Before 2024 Ends?Once again, the price of Ethereum (ETH) has risen above $3,900. This bounce has hinted at a further price increase for the altcoin before the end of the year.
Author  Beincrypto
Dec 17, 2024
Once again, the price of Ethereum (ETH) has risen above $3,900. This bounce has hinted at a further price increase for the altcoin before the end of the year.
placeholder
ECB Policy Outlook for 2026: What It Could Mean for the Euro’s Next MoveWith the ECB likely holding rates steady at 2.15% and the Fed potentially extending cuts into 2026, EUR/USD may test 1.20 if Eurozone growth proves resilient, but weaker growth and an ECB pivot could pull the pair back toward 1.13 and potentially 1.10.
Author  Mitrade
Dec 26, 2025
With the ECB likely holding rates steady at 2.15% and the Fed potentially extending cuts into 2026, EUR/USD may test 1.20 if Eurozone growth proves resilient, but weaker growth and an ECB pivot could pull the pair back toward 1.13 and potentially 1.10.
placeholder
WTI climbs above $95.50 as Iran says the Strait of Hormuz must remain closed West Texas Intermediate (WTI), the US crude oil benchmark, is trading around $95.75 during the early Asian trading hours on Friday. The WTI price surges due to the effective closure of the Strait of Hormuz amid conflict involving the United States (US), Israel, and Iran.
Author  FXStreet
Mar 13, Fri
 West Texas Intermediate (WTI), the US crude oil benchmark, is trading around $95.75 during the early Asian trading hours on Friday. The WTI price surges due to the effective closure of the Strait of Hormuz amid conflict involving the United States (US), Israel, and Iran.
placeholder
Breaking: Gold falls below $5,000 as oil-driven inflation fears weighGold price (XAU/USD) tumbles to around $4,980 during the early Asian session on Monday. The precious metal faces some selling pressure despite intense geopolitical conflict in the Middle East. Traders will closely monitor the developments surrounding the United States (US)-Israel war with Iran. 
Author  FXStreet
12 hours ago
Gold price (XAU/USD) tumbles to around $4,980 during the early Asian session on Monday. The precious metal faces some selling pressure despite intense geopolitical conflict in the Middle East. Traders will closely monitor the developments surrounding the United States (US)-Israel war with Iran. 
Related Instrument
goTop
quote