NZD/JPY Price Analysis: Bearish forces at play, bulls continue strugguling

Source Fxstreet
  • The NZD/JPY trades neutral after getting rejected by the 20-day SMA.
  • The daily chart shows that the RSI reveals weak buying traction.
  • The hourly chart also showcases a similar situation with its RSI hinting at weak buying pressure.

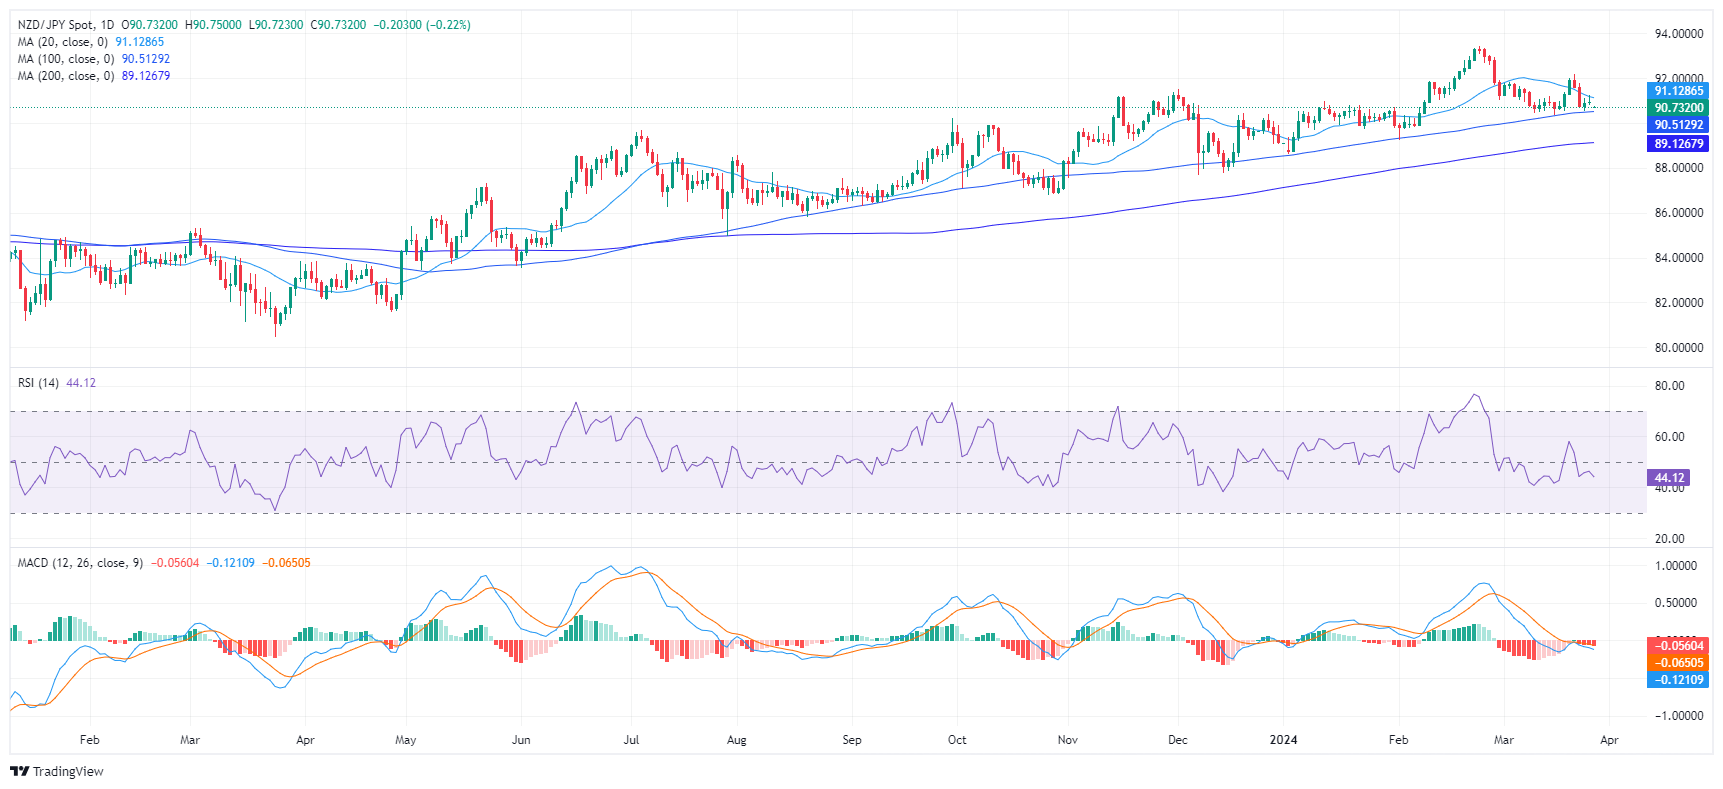
The NZD/JPY is currently trading at 90.90, mostly neutral after trimming daily gains. From a broader perspective, the pair's position above the 100 and 200-day Simple Moving Averages (SMAs) suggests that despite the weakened buying momentum, the bulls continue to assert their control. Buyers must target the 20-day SMA to continue edging higher.

On the daily chart, the current market dynamics for the NZD/JPY pair reveal a neutral to negative trend as buyers are struggling to gather traction. The Relative Strength Index (RSI) presently resides in the negative territory. This trend is further emphasized by the red bars of the Moving Average Convergence Divergence (MACD), which reveals a steady selling momentum and weakened buying traction.

NZD/JPY daily chart

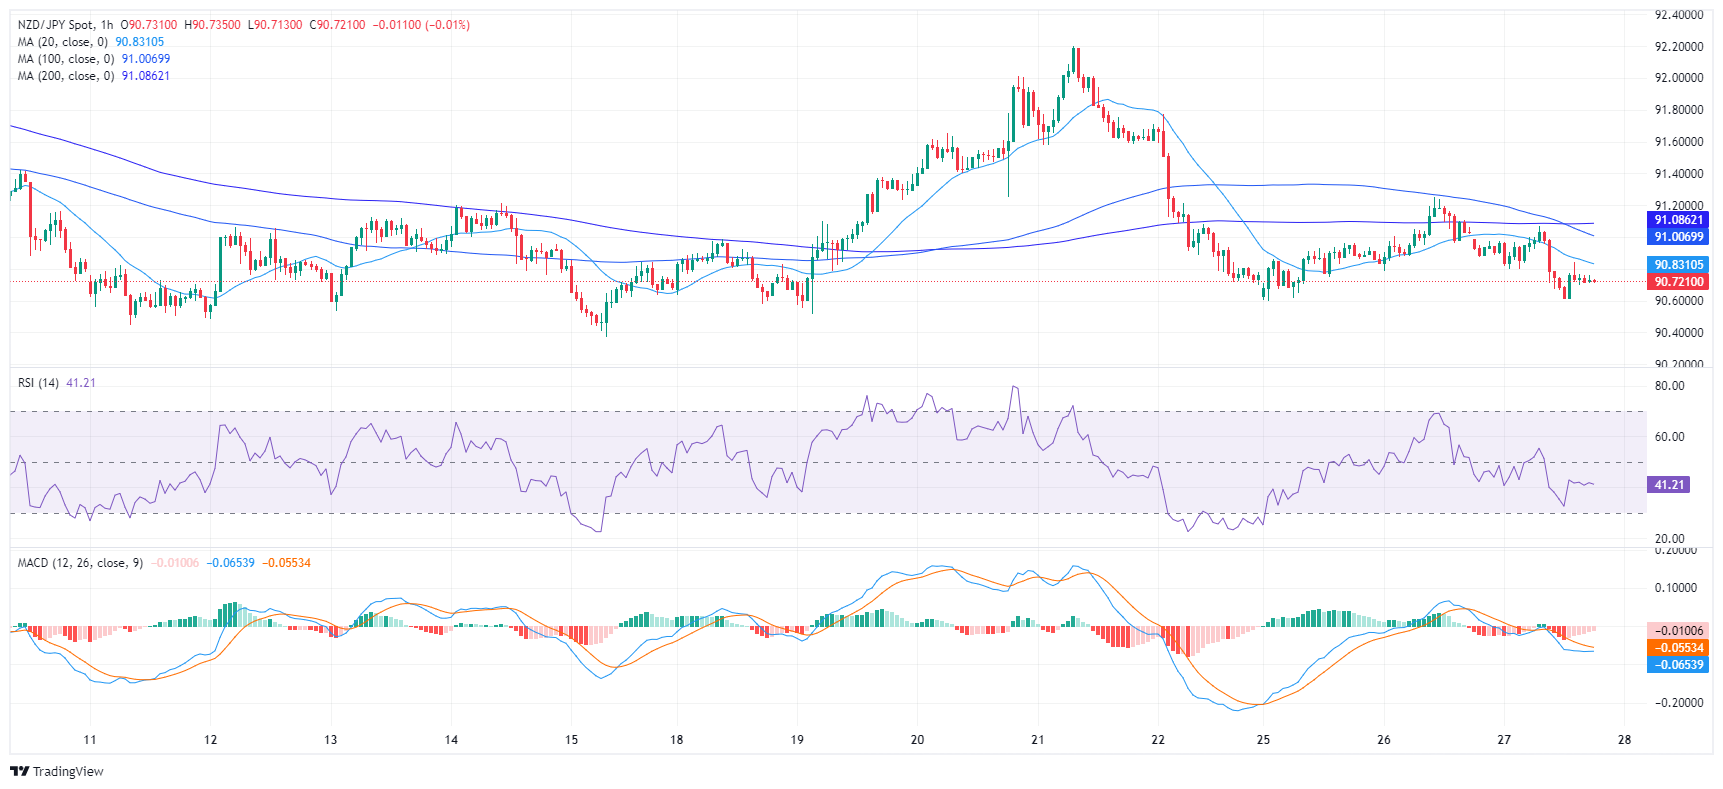
Switching to the hourly chart, the RSI recently read 41, which also positions it within negative territory. As with the daily chart, the MACD histogram on the hourly also illustrates flat red bars, further signifying weak market momentum.

NZD/JPY hourly chart

In conclusion, both the daily and hourly charts indicate a negative trend for NZD/JPY with weak buying pressure. Notwithstanding, on a larger scale, the pair remains above the 100 and 200-day Simple Moving Averages, hinting that bulls may still have broader control of the market. The negative market outlook could be further confirmed if the 20 and 100-day SMA complete a bearish crossover around the 91.00 area.


NZD/JPY

Overview
Today last price 90.73
Today Daily Change -0.21
Today Daily Change % -0.23
Today daily open 90.94
 
Trends
Daily SMA20 91.18
Daily SMA50 91.16
Daily SMA100 90.5
Daily SMA200 89.11
 
Levels
Previous Daily High 91.25
Previous Daily Low 90.78
Previous Weekly High 92.2
Previous Weekly Low 90.52
Previous Monthly High 93.45
Previous Monthly Low 89.26
Daily Fibonacci 38.2% 91.07
Daily Fibonacci 61.8% 90.96
Daily Pivot Point S1 90.73
Daily Pivot Point S2 90.52
Daily Pivot Point S3 90.26
Daily Pivot Point R1 91.19
Daily Pivot Point R2 91.45
Daily Pivot Point R3 91.66


Disclaimer: For information purposes only. Past performance is not indicative of future results.
placeholder
Top 3 Price Prediction: Bitcoin, Ethereum, Ripple – BTC, ETH and XRP Look for a Foothold After a Sharp ShakeoutBitcoin trades near $92,600 after a dip below $90,000, while Ethereum around $3,118 and XRP near $2.21–$2.23 sit on key support zones, as BTC, ETH and XRP all try to turn a sharp correction into a tradable rebound rather than a deeper slide.
Author  Mitrade
Nov 19, Wed
Bitcoin trades near $92,600 after a dip below $90,000, while Ethereum around $3,118 and XRP near $2.21–$2.23 sit on key support zones, as BTC, ETH and XRP all try to turn a sharp correction into a tradable rebound rather than a deeper slide.
placeholder
Market Meltdown: BTC, ETH, and XRP Capitulate as Bears Seize ControlBitcoin trades around $85,900 after breaking below $86,000, with Ethereum under $2,791 and XRP below $1.99 as BTC, ETH and XRP extend weekly losses of 8–10%, forcing traders to focus on supports at $85,000, $2,749 and $1.77 for clues on whether this sell-off has further to run.
Author  Mitrade
Nov 21, Fri
Bitcoin trades around $85,900 after breaking below $86,000, with Ethereum under $2,791 and XRP below $1.99 as BTC, ETH and XRP extend weekly losses of 8–10%, forcing traders to focus on supports at $85,000, $2,749 and $1.77 for clues on whether this sell-off has further to run.
placeholder
Bitcoin Volatility Spikes: Is Options-Driven Pricing Making a Comeback?Bitcoin's volatility is surging, suggesting a shift back to options-driven price action seen before Bitcoin ETFs were launched.
Author  Mitrade
Nov 24, Mon
Bitcoin's volatility is surging, suggesting a shift back to options-driven price action seen before Bitcoin ETFs were launched.
placeholder
Gold Price Forecast: XAU/USD rises to near $4,150 as Fed rate cut bets growGold price (XAU/USD) attracts some buyers to around $4,140 during the early Asian session on Tuesday. The precious metal rises on growing expectations of a US Federal Reserve (Fed) interest rate cut in the December policy meeting.
Author  FXStreet
Yesterday 01: 29
Gold price (XAU/USD) attracts some buyers to around $4,140 during the early Asian session on Tuesday. The precious metal rises on growing expectations of a US Federal Reserve (Fed) interest rate cut in the December policy meeting.
placeholder
Bitcoin Price Rebound Gains Traction with $90K Break in SightBitcoin is trading above $87,000 and its 100-hour SMA after rebounding from $83,500, with a bearish trend line at $88,200 and resistance at $89,000–$90,000 now in focus as BTC either breaks higher toward $91,750–$94,000 or slips back toward $86,700, $85,000 and lower supports.
Author  Mitrade
3 hours ago
Bitcoin is trading above $87,000 and its 100-hour SMA after rebounding from $83,500, with a bearish trend line at $88,200 and resistance at $89,000–$90,000 now in focus as BTC either breaks higher toward $91,750–$94,000 or slips back toward $86,700, $85,000 and lower supports.
goTop
quote