

Dogecoin Price Prediction: Could DOGE ETF spark new all-time high after 130% rise?

Source Fxstreet

Dogecoin price today: $0.3800

  • Dogecoin is the best-performing asset among the top 100 tokens by market cap following a 130% rise. 
  • Eric Balchunas hinted at the launch of a DOGE ETF, which could lower the skeptical view of investors toward memecoins.
  • DOGE could rally to test its all-time high if it overcomes the $0.5900 key hurdle.

Dogecoin (DOGE) rose over 15% on Tuesday as traders anticipate a price move toward the $1 threshold following Bloomberg analyst Eric Balchunas's post regarding a DOGE exchange-traded fund (ETF).

Dogecoin could be on the brink of an ETF launch as prices continue upward march

Dogecoin has witnessed double-digit gains in the past 24 hours, rising over 15% as the general crypto market rallied. It currently trends as the best-performing asset among the top 100 tokens, seeing over 130% gain on the weekly timeframe, per CoinGecko data.

The momentous rise saw Dogecoin's market capitalization cross the $56 billion mark, surpassing that of automotive company Ford in the process. DOGE's impressive run dates back to October 13, since which it has risen over 250%.

Following another round of price rally on Tuesday,  Bloomberg senior ETF analyst Eric Balchunas hinted at the possibility of a DOGE ETF after Canary Capital's S-1 application for an HBAR ETF.

Eric Balchunas played a crucial role in the Bitcoin and Ethereum ETFs approval timeline by providing regular updates and insights on regulatory developments.

Hence, most Dogecoin community members are showing increased interest after Balchunas' tweet.

Crypto expert Andrew Kang predicted in March that the approval of a DOGE ETF holds a 30% chance, particularly if regulatory clarity improves.

Although there is currently no application for a DOGE ETF, most crypto community members are preparing for asset managers to submit one soon, especially after Republican candidate Donald Trump won the US presidential elections last Tuesday.

As anticipation builds for a DOGE ETF, Dogecoin could extend its gains and tackle its all-time high resistance.

Additionally, a DOGE ETF could lower the skepticism toward meme coins by giving institutional investors exposure to Dogecoin's price.

Dogecoin Price Forecast: DOGE could test its all-time high if it rallies above the $0.5900 resistance

Dogecoin sustained over $127 million in liquidations in the past 24 hours, with liquidated long and short positions accounting for $63.69 and $64.10 million, per Coinglass data.

DOGE aims to tackle the resistance level of a key rectangular channel near $0.4483 after charging above the $0.3517 resistance of August 2021. A firm close above $0.4483 will see DOGE tackling the $0.5900 resistance of May 2021 and stage a rally toward a new all-time high.
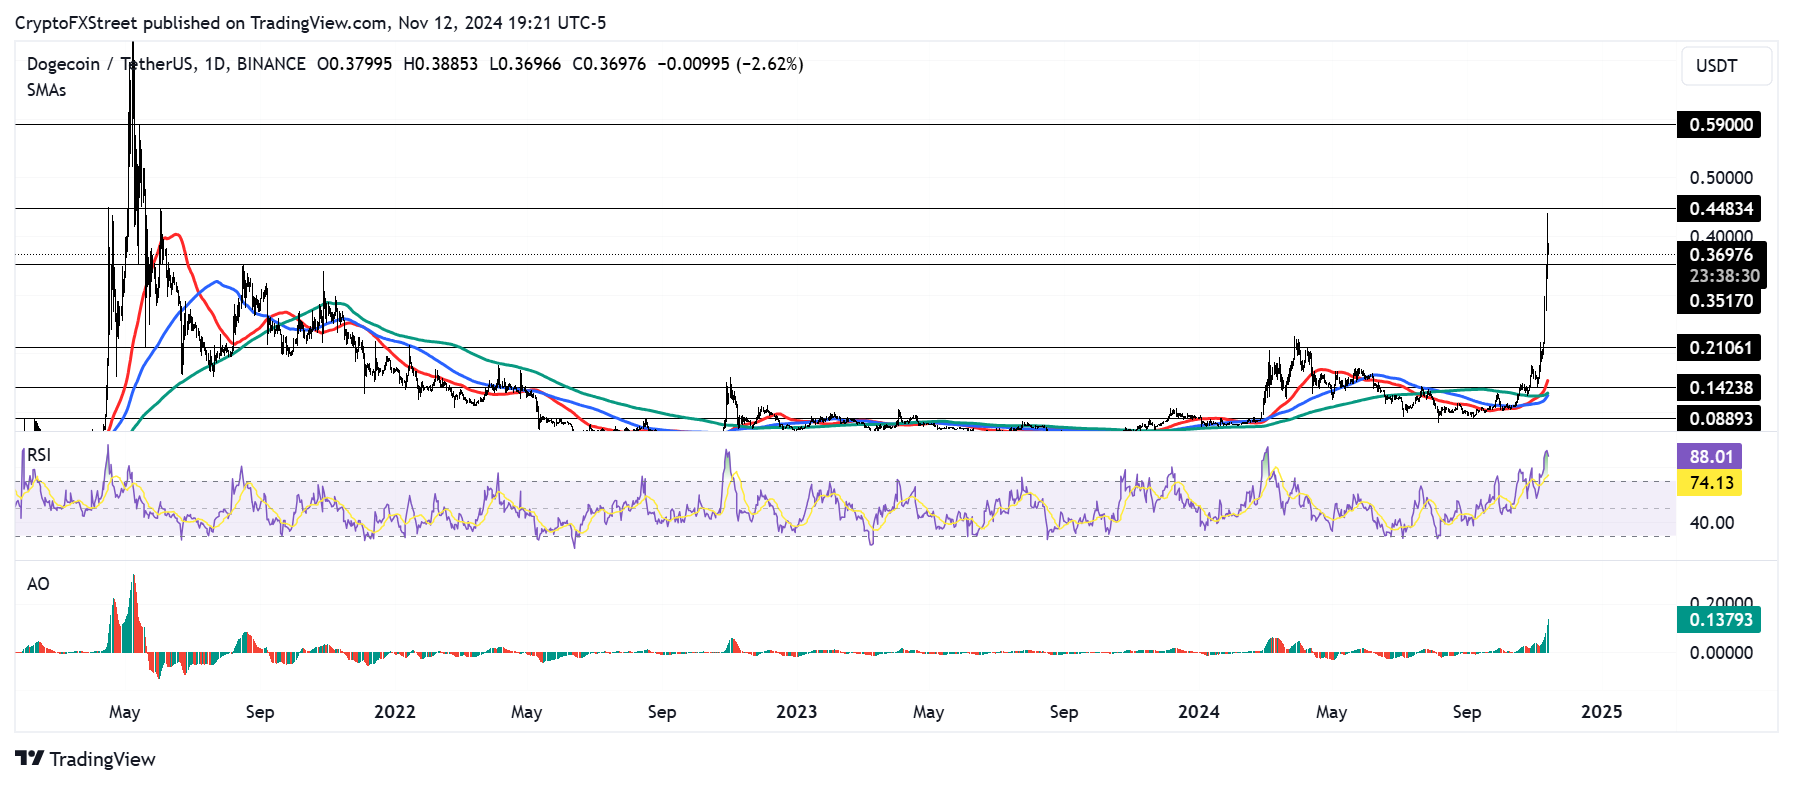
DOGE/USDT daily chart

DOGE/USDT daily chart

Crypto analyst Ali Martinez also suggests a similar bullish outlook as DOGE's Market Value to Realized Value (MVRV) is at 45.65%. This is below the 78% mark, which often indicates market tops in previous cycles. Hence, DOGE still has room to run.

The Relative Strength Index (RSI) is in the oversold region, indicating a potential price correction is imminent.

A daily candlestick close below $0.3517 will invalidate the bullish thesis.

Disclaimer: For information purposes only. Past performance is not indicative of future results.
placeholder
Big Tech's $800 billion AI bill faces its first real test — free cash flow is the judgeAlphabet and Microsoft report after the close on October 28, Amazon on October 29, with hyperscaler AI capex running near $800 billion a year. Meta's negative free cash flow and 9.40% drop on October 22 was the warning; this week's prints decide whether cloud growth and backlog can pay for the buildout. Here are the consensus numbers, the free-cash-flow table and the two-sided test.
Author  Irene Q.
Oct 26, Mon
Alphabet and Microsoft report after the close on October 28, Amazon on October 29, with hyperscaler AI capex running near $800 billion a year. Meta's negative free cash flow and 9.40% drop on October 22 was the warning; this week's prints decide whether cloud growth and backlog can pay for the buildout. Here are the consensus numbers, the free-cash-flow table and the two-sided test.
placeholder
Anthropic files for a $2 trillion IPO — the $80.7 billion loss is the decoy, the $450 billion compute bill is the riskAnthropic publicly filed its S-1 on October 26, revealing $16.29 billion of first-half revenue (+1,304% year over year) and a $80.7 billion net loss — of which $72.4 billion is a non-cash convertible-note charge. The real number is the $450 billion of signed, mostly non-cancelable compute commitments. Here is what the filing says, why NVDA, ARM and MU are the tradeable read-through, and the conditions that decide whether the AI trade passes its first public valuation test.
Author  Irene Q.
Oct 27, Tue
Anthropic publicly filed its S-1 on October 26, revealing $16.29 billion of first-half revenue (+1,304% year over year) and a $80.7 billion net loss — of which $72.4 billion is a non-cash convertible-note charge. The real number is the $450 billion of signed, mostly non-cancelable compute commitments. Here is what the filing says, why NVDA, ARM and MU are the tradeable read-through, and the conditions that decide whether the AI trade passes its first public valuation test.
placeholder
Fed October Rate Decision Preview: Rate Hike Pause Has Become Consensus, How Will US Stocks, Dollar, and Gold React?The Federal Reserve will announce its October interest rate decision at 14:00 Eastern Time on October 28, and Fed Chair Warsh will hold a press conference at 14:30. Markets currently wide
Author  TradingKey
Oct 27, Tue
The Federal Reserve will announce its October interest rate decision at 14:00 Eastern Time on October 28, and Fed Chair Warsh will hold a press conference at 14:30. Markets currently wide
placeholder
Brent's $115 front month sits $4.6 above January — the $14 spread to WTI is the supply-risk premiumDecember Brent trades at $115.29 while January is $110.71, a $4.58 backwardation. The December Brent-WTI spread is $14.2, versus a $3-5 normal. That gap, not the headline, is where the Middle East supply risk is priced. Here is what the curve says, why the December contract's expiry on October 30 will mechanically cut the headline by $4.6, and the 108.81 neckline that decides the next move.
Author  Irene Q.
Yesterday 06: 21
December Brent trades at $115.29 while January is $110.71, a $4.58 backwardation. The December Brent-WTI spread is $14.2, versus a $3-5 normal. That gap, not the headline, is where the Middle East supply risk is priced. Here is what the curve says, why the December contract's expiry on October 30 will mechanically cut the headline by $4.6, and the 108.81 neckline that decides the next move.
placeholder
Gold Price Analysis Today | Forex Gold Analysis | XAU/USD Analysis - October 29, 2026Get the latest gold price analysis, forex gold insights, and XAU/USD analysis for October 29, 2026. Read on for the details.
Author  Mitrade
7 hours ago
Get the latest gold price analysis, forex gold insights, and XAU/USD analysis for October 29, 2026. Read on for the details.
Related Instrument
goTop
quote