

USD/CAD Price Analysis: Recovers intraday losses as US Dollar rebounds with US NFP looms

- Gold Price Forecast: Gold Poised to Break $4,200 as Oil Price Slump Eases Inflation Fears
- Gold declines despite easing concerns over inflation, interest rate hikes
- Fed Decision Eve: 104 Economists Expect No Change; Why Is Citadel Securities Betting on a Surprise Hike?
- Gold Price Forecast: Can Gold Hold $4,020 as Fed Rate Hike Expectations Rise?
- Middle East War updates: US-Iran pause strikes as Trump weighs up diplomatic options
- WTI Oil flirts with the $80 level amid speculation about US-Iran peace talks
■USD/CAD rebounds from 1.3666 as the US Dollar holds ground ahead of US NFP data.
■The BoC announces a rate cut decision, as expected, and emphasizes a data-centric approach for the interest-rate path.
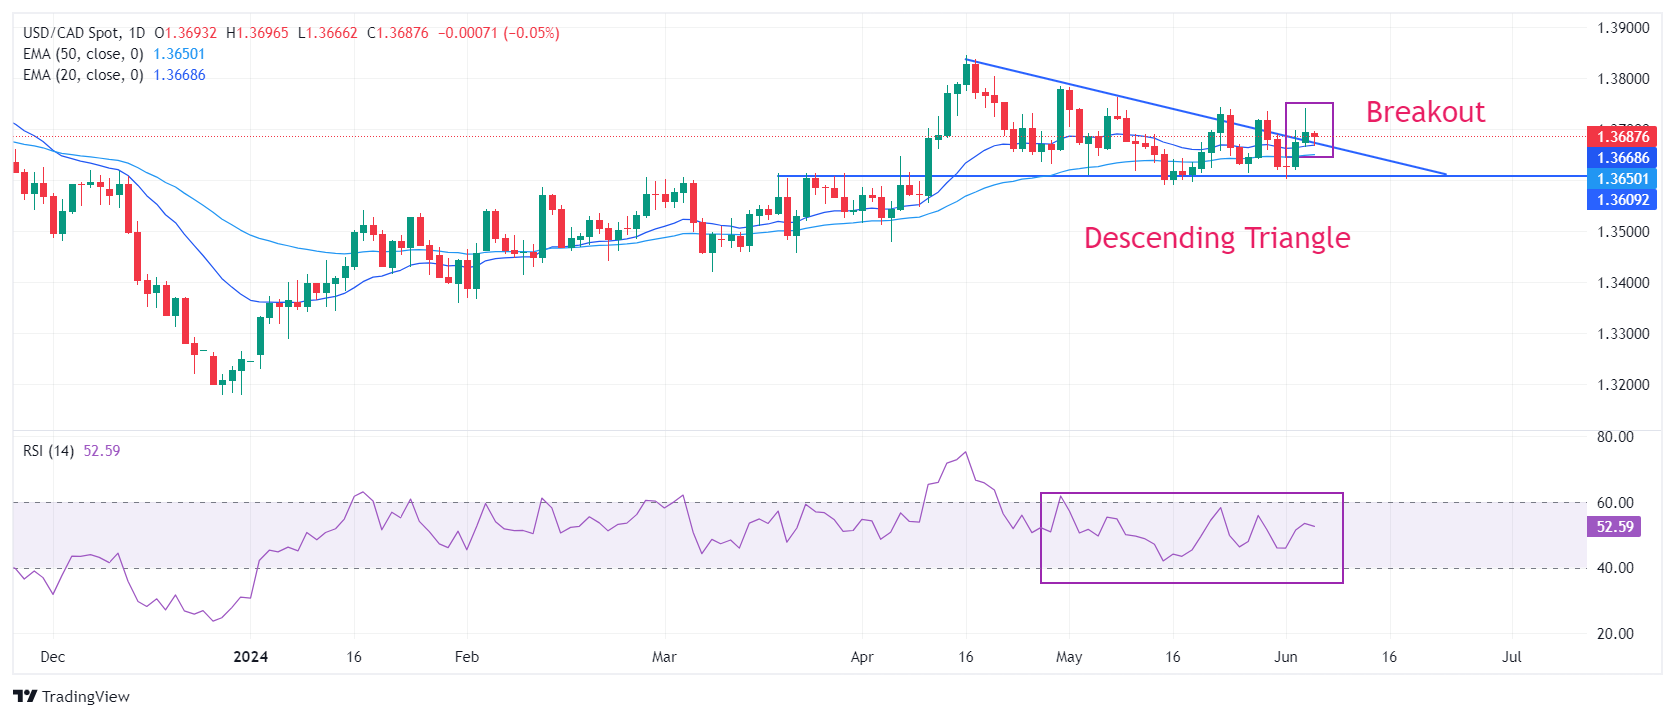
■USD/CAD holds the Descending Triangle breakout.
The USD/CAD pair bounces back from the day’s low of 1.3666 in Thursday’s London session. The Loonie asset rebounds as the US Dollar recovers intraday losses. The US Dollar Index (DXY) rebounds from the crucial support of 104.00 as investors turn cautious ahead of the United States Nonfarm Payrolls (NFP) report for May, which will be published on Friday.
The US NFP report will impact market speculation for Federal Reserve (Fed) rate cuts, which investors expect that it will start from the September meeting. Higher-than-expected payrolls and wage growth momentum would force traders to push back Fed rate-cut bets while soft numbers will do the opposite.
Meanwhile, the Canadian Dollar is expected to remain on the backfoot as the Bank of Canada (BoC) becomes the first central bank of G-7 nations, which has initiated the rate-cut cycle. The BoC reduced interest rates by 25 basis points (bps) to 4.75% on Wednesday. Investors had already priced in a rate-cut move as Canada’s preferred inflation measure, which is BoC’s core Consumer Price Index (CPI), has already come down below 2%, and the labor market conditions are vulnerable.
Regarding the interest rate outlook, BoC Governor Tiff Macklem commented that if inflation continues to ease and the economy's behaviour remains in line with the bank’s forecast, it would become appropriate to cut interest rates further.
The near-term outlook of the USD/CAD pair remains firm as it holds the breakout of the Descending Triangle chart formation on a daily timeframe. A breakout of the above-mentioned chart pattern results in heavy volume and wider ticks on the upside.
Upward-sloping 20-and 50-day Exponential Moving Average (EMA), which trade around 1.3675 and 1.3650, respectively, suggest that the near-term trend is bullish.
The 14-period Relative Strength Index (RSI) oscillates in the 40.00-60.00 range, indicating indecisiveness among market participants.
Fresh buying opportunity would emerge if the asset breaks above April 30 high at 1.3785. This would drive the asset towards April 17 high at 1.3838, followed by the round-level resistance of 1.3900.
In an alternate scenario, a breakdown below May 3 low around 1.3600 will expose the asset to the April 9 low around 1.3547 and the psychological support of 1.3500.
USD/CAD daily chart
Read more
* The content presented above, whether from a third party or not, is considered as general advice only. This article should not be construed as containing investment advice, investment recommendations, an offer of or solicitation for any transactions in financial instruments.


