USD/CAD Price Forecast: Trades lower near 1.3850 after retreating from nine-day EMA

Mitrade
coverImg
Source: DepositPhotos
  • USD/CAD finds Initial resistance at the nine-day EMA around 1.3890.

  • The 14-day RSI is positioned above the 30 level, suggesting a continuation of short-term corrective bounce.

  • The pair may find primary support at the six-month low of 1.3781.


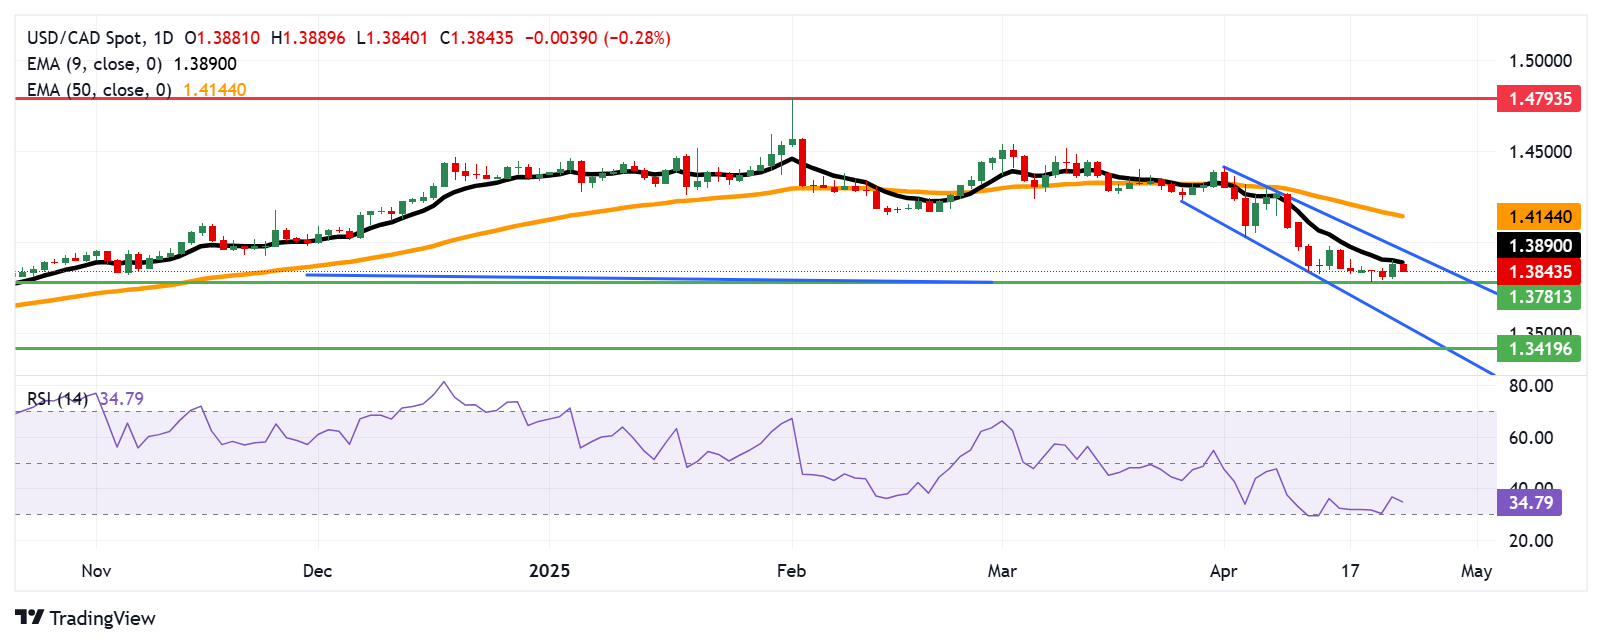
The USD/CAD pair retraces its gains from the previous session, trading around 1.3850 during the European session on Thursday. Daily chart technical analysis highlights a prevailing bearish trend, with the pair continuing its descent within a well-defined descending channel.


Additionally, the USD/CAD pair remains below the nine-day Exponential Moving Average (EMA), reflecting weak short-term momentum. Meanwhile, the 14-day Relative Strength Index (RSI) is positioned above the 30 level, suggesting a continuation of short-term corrective bounce. However, with the RSI still holding below the 50 mark, the broader bearish outlook persists.


On the downside, the USD/CAD pair may retest the six-month low of 1.3781, last seen on April 21. A decisive break below this level would strengthen the bearish outlook, potentially guiding the pair toward the lower boundary of the descending channel near the 1.3550 zone, with further support around 1.3419 — its lowest level since February 2024.


Initial resistance for USD/CAD is seen at the nine-day EMA around 1.3890, followed by the upper boundary of the descending channel near 1.3970. A breakout above this channel could indicate a shift toward a bullish bias, potentially opening the door for a move toward the 50-day EMA at 1.4144. Further upside could target the next major resistance at 1.4793 — the lowest level recorded since April 2003.


USD/CAD: Daily Chart


Canadian Dollar PRICE Today


The table below shows the percentage change of Canadian Dollar (CAD) against listed major currencies today. Canadian Dollar was the weakest against the Euro.


17454883868821


The heat map shows percentage changes of major currencies against each other. The base currency is picked from the left column, while the quote currency is picked from the top row. For example, if you pick the Canadian Dollar from the left column and move along the horizontal line to the US Dollar, the percentage change displayed in the box will represent CAD (base)/USD (quote).

Read more

  • Gold rebounds to near $4,350 on weaker US Dollar, falling oil prices
  • Have Fed Rate Hike Headwinds Been Priced In? Gold Rebounds Strongly Toward $4,400, Poised for a New Rally
  • Bitcoin falls below $75,000 as the CLARITY Act fails in the Senate — what the vote means for crypto
  • * The content presented above, whether from a third party or not, is considered as general advice only.  This article should not be construed as containing investment advice, investment recommendations, an offer of or solicitation for any transactions in financial instruments.

    goTop
    quote
    Related Articles
    placeholder
    US to delay new "overcapacity" tariffs on China — what the pause means for trade, inflation and the dollarWashington is expected to hold off announcing new tariffs over Chinese "overcapacity" until after the 24 September summit, according to Bloomberg. The postponed plan would have added 7.5% to Chinese goods, taking second-term US tariffs to around 20%. Here is what is on the table, and what a deal versus no deal would mean for the yuan, Hong Kong equities and the dollar.
    Author  Mitrade
    Sep 18, Fri
    Washington is expected to hold off announcing new tariffs over Chinese "overcapacity" until after the 24 September summit, according to Bloomberg. The postponed plan would have added 7.5% to Chinese goods, taking second-term US tariffs to around 20%. Here is what is on the table, and what a deal versus no deal would mean for the yuan, Hong Kong equities and the dollar.
    placeholder
    Dollar index tops 100 for the first time since July as the Fed's hawkish dot plot sinks inThe U.S. dollar index broke back above 100 for the first time since 31 July after the Fed delivered its first rate hike since 2023, with the dot plot showing 16 of 18 officials expect at least one more increase this year. Here are the levels that matter for DXY, the currencies feeling it most, and what to watch next.
    Author  Irene Q.
    Sep 17, Thu
    The U.S. dollar index broke back above 100 for the first time since 31 July after the Fed delivered its first rate hike since 2023, with the dot plot showing 16 of 18 officials expect at least one more increase this year. Here are the levels that matter for DXY, the currencies feeling it most, and what to watch next.
    placeholder
    US dollar clings to nine-week lows near 98.4 as Brent nears $100 and the yen hits a seven-month high — five events to watch todayThe dollar is pinned near nine-week lows even after a blockbuster jobs report, as an oil spike toward $100, a surging yen and China's reflation data crowd the driver's seat. Five key events to watch today: Brent at $99.46, USD/JPY at 154, China CPI/PPI, PBOC gold buying, and Thursday's PPI / Friday's CPI ahead of the September 15-16 FOMC.
    Author  Eric Nkando
    Sep 09, Wed
    The dollar is pinned near nine-week lows even after a blockbuster jobs report, as an oil spike toward $100, a surging yen and China's reflation data crowd the driver's seat. Five key events to watch today: Brent at $99.46, USD/JPY at 154, China CPI/PPI, PBOC gold buying, and Thursday's PPI / Friday's CPI ahead of the September 15-16 FOMC.
    placeholder
    AUD/USD climbs for a fourth day to 0.7218 as Fed-hike bets fail to lift the dollar; RBA speakers and US CPI now in focusThe Australian dollar has risen for four straight sessions toward 0.72 even after August nonfarm payrolls far exceeded expectations and pushed September Fed-hike odds to 58.4%. A thin, holiday-thinned dollar is the short-term driver; Westpac confidence and RBA speakers today, US PPI/CPI this week and the Sept 15-16 FOMC will decide whether the rally holds.
    Author  Irene Q.
    Sep 08, Tue
    The Australian dollar has risen for four straight sessions toward 0.72 even after August nonfarm payrolls far exceeded expectations and pushed September Fed-hike odds to 58.4%. A thin, holiday-thinned dollar is the short-term driver; Westpac confidence and RBA speakers today, US PPI/CPI this week and the Sept 15-16 FOMC will decide whether the rally holds.
    placeholder
    Japanese Yen rallies to February 18 high as upbeat wage data and GDP lift BoJ hike betsThe USD/JPY pair declines for the second straight day – also marking the fourth day of a fall in the previous five – and sinks to its lowest level since February 18, around mid-153.00s during the Asian session on Tuesday.
    Author  FXStreet
    Sep 08, Tue
    The USD/JPY pair declines for the second straight day – also marking the fourth day of a fall in the previous five – and sinks to its lowest level since February 18, around mid-153.00s during the Asian session on Tuesday.
    Live Quotes
    Name / SymbolChart% Change / Price
    USDCAD
    USDCAD
    0.00%0.00

    Forex Related Articles

    • How to Identify Forex Scams? Warning Signs Every Trader Should Know
    • Stop Loss: Your Savior In The Market
    • Is Mitrade a Legit Broker? A Transparent Review of Security, Platform, and Trading Conditions (2026 Updated)
    • Is Mitrade Right for You? A Complete Guide on How to Start Trading CFDs in 5 Steps
    • 6 Leading ASIC-Regulated Forex Trading Platforms&Apps in Australia (2026 Update)
    • Forex Trading In Malaysia - Top 10 Forex Brokers for Malaysia: Regulated & Trader-Friendly Picks

    Click to view more