USD/CAD Price Forecast: Breaks below 1.3950 as bearish bias prevails

Mitrade
Trending Articles
coverImg
Source: DepositPhotos
  • USD/CAD could extend its decline, with the daily chart pointing to a sustained bearish trend.

  • The 14-day RSI remains below the 50 mark, reinforcing the persistent bearish bias.

  • The nine-day EMA near 1.4023 could serve as the immediate resistance level.


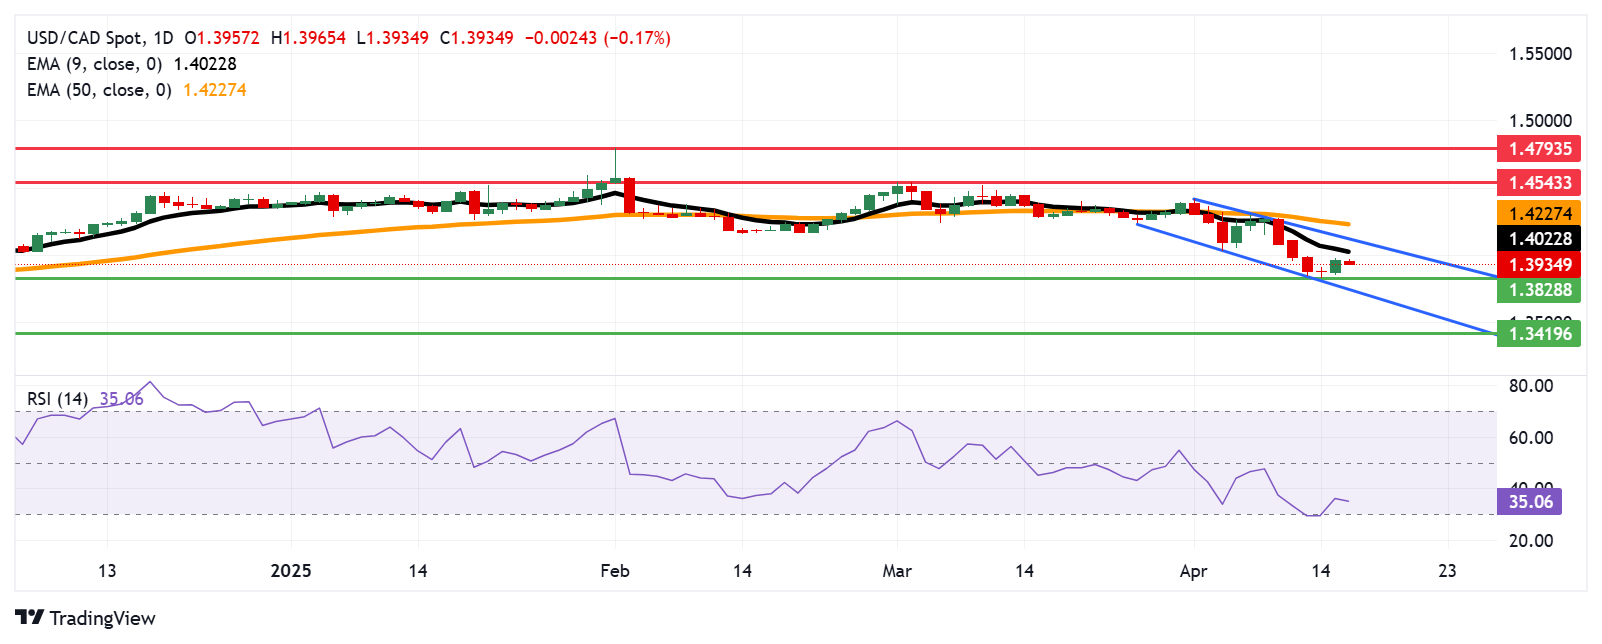
The USD/CAD pair slips slightly after posting gains in the previous session, trading near 1.3940 during Wednesday’s Asian session. Technical analysis on the daily chart indicates a prevailing bearish trend as the pair continues to move lower within a descending channel.


Additionally, the USD/CAD pair continues to trade below the nine-day Exponential Moving Average (EMA), indicating subdued short-term momentum. At the same time, the 14-day Relative Strength Index (RSI) has climbed above the 30 level, hinting at a potential short-term corrective rebound. However, with the 14-day RSI still below the 50 threshold, the overall bearish bias remains intact.


On the downside, the USD/CAD pair could revisit the six-month low of 1.3828, recorded on Monday, aligning closely with the lower boundary of the descending channel around the 1.3750 region. A clear break below this support zone would likely strengthen the bearish outlook and open the door for a decline toward the 1.3419 area — the lowest level since February 2024.


Initial resistance for the USD/CAD pair is located at the nine-day EMA around 1.4023, followed by the upper boundary of the descending channel near 1.4130. A breakout above this channel could signal a shift to a bullish bias, potentially pushing the pair toward the 50-day EMA at 1.4227. Beyond that, the next key resistance lies at the two-month high of 1.4543, reached on March 4.


USD/CAD: Daily Chart


Canadian Dollar PRICE Today


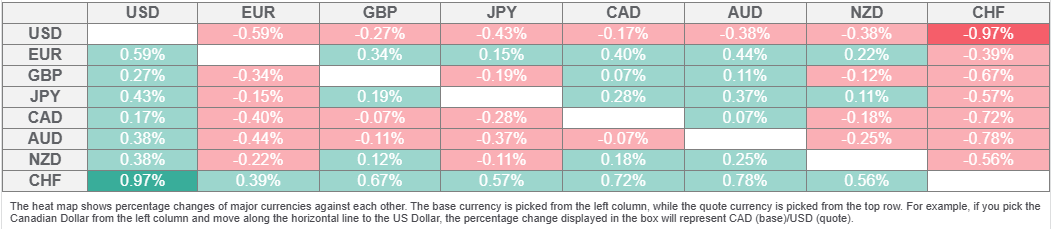
The table below shows the percentage change of Canadian Dollar (CAD) against listed major currencies today. Canadian Dollar was the weakest against the Swiss Franc.

17447833216741


The heat map shows percentage changes of major currencies against each other. The base currency is picked from the left column, while the quote currency is picked from the top row. For example, if you pick the Canadian Dollar from the left column and move along the horizontal line to the US Dollar, the percentage change displayed in the box will represent CAD (base)/USD (quote).

Read more

  • Copper Price Forecast: Tight Supply Pushes Price Above $14,000, Can Copper Reach $15,000?
  • * The content presented above, whether from a third party or not, is considered as general advice only.  This article should not be construed as containing investment advice, investment recommendations, an offer of or solicitation for any transactions in financial instruments.

    goTop
    quote
    Related Articles
    placeholder
    Forex Today: US Dollar stabilizes ahead of next batch of US dataHere is what you need to know on Thursday, August 13:
    Author  FXStreet
    Aug 13, Thu
    Here is what you need to know on Thursday, August 13:
    placeholder
    Australian Dollar remains calm following Trade Balance dataAUD/USD steadies after two days of gains, trading around 0.7060 during the Asian hours on Thursday. The pair moves little as the Australian Dollar (AUD) remains silent following the release of domestic Trade Balance data.
    Author  FXStreet
    Aug 06, Thu
    AUD/USD steadies after two days of gains, trading around 0.7060 during the Asian hours on Thursday. The pair moves little as the Australian Dollar (AUD) remains silent following the release of domestic Trade Balance data.
    placeholder
    Forex Today: Mideast uncertainty keeps USD supported ahead of next batch of US dataHere is what you need to know on Tuesday, August 4:
    Author  FXStreet
    Aug 04, Tue
    Here is what you need to know on Tuesday, August 4:
    placeholder
    Japanese Yen bears turn cautious near four-decade low amid looming intervention risksThe USD/JPY enters a bullish consolidation phase during the Asian session on Wednesday and holds steady above the 163.00 mark, near its highest level since 1986 set the previous day.
    Author  FXStreet
    Jul 22, Wed
    The USD/JPY enters a bullish consolidation phase during the Asian session on Wednesday and holds steady above the 163.00 mark, near its highest level since 1986 set the previous day.
    placeholder
    Euro declines to near 1.1400 as US launches fresh strikes on IranThe EUR/USD pair posts modest losses around 1.1410 during the early Asian trading hours on Tuesday. Renewed tensions between the United States (US) and Iran continue to fuel risk-off sentiment, weighing on the Euro (EUR) against the US Dollar (USD).
    Author  FXStreet
    Jul 21, Tue
    The EUR/USD pair posts modest losses around 1.1410 during the early Asian trading hours on Tuesday. Renewed tensions between the United States (US) and Iran continue to fuel risk-off sentiment, weighing on the Euro (EUR) against the US Dollar (USD).
    Live Quotes
    Name / SymbolChart% Change / Price
    USDCAD
    USDCAD
    0.00%0.00

    Forex Related Articles

    • How to Identify Forex Scams? Warning Signs Every Trader Should Know
    • Stop Loss: Your Savior In The Market
    • Is Mitrade a Legit Broker? A Transparent Review of Security, Platform, and Trading Conditions (2026 Updated)
    • Is Mitrade Right for You? A Complete Guide on How to Start Trading CFDs in 5 Steps
    • 6 Leading ASIC-Regulated Forex Trading Platforms&Apps in Australia (2026 Update)
    • Forex Trading In Malaysia - Top 10 Forex Brokers for Malaysia: Regulated & Trader-Friendly Picks

    Click to view more