

USD/CAD Price Forecast: Support appears at 1.3850 with potential corrective rebounds

- Gold Price Trend Forecast: Why Did Gold Prices Fall After US CPI Cooled? Fed Chair Speech and Iran Situation Become Obstacles
- Gold Price Trend Forecast: June CPI Plus Fed Chair Congressional Testimony, Can Gold Price Hold Above $4,000?
- Gold slides back closer to $4,050 as Iran risks and Fed hike bets boost USD
- Gold recovers above $4,100 as traders assess US-Iran conflict
- WTI rally takes a timeout amid signs of US-Iran war de-escalation
- Today’s Market Recap: Unexpected PPI Drop Boosts Markets, Apple Hits All-Time High, AI Hardware Stocks Remain Under Pressure, Micron, SanDisk Slump
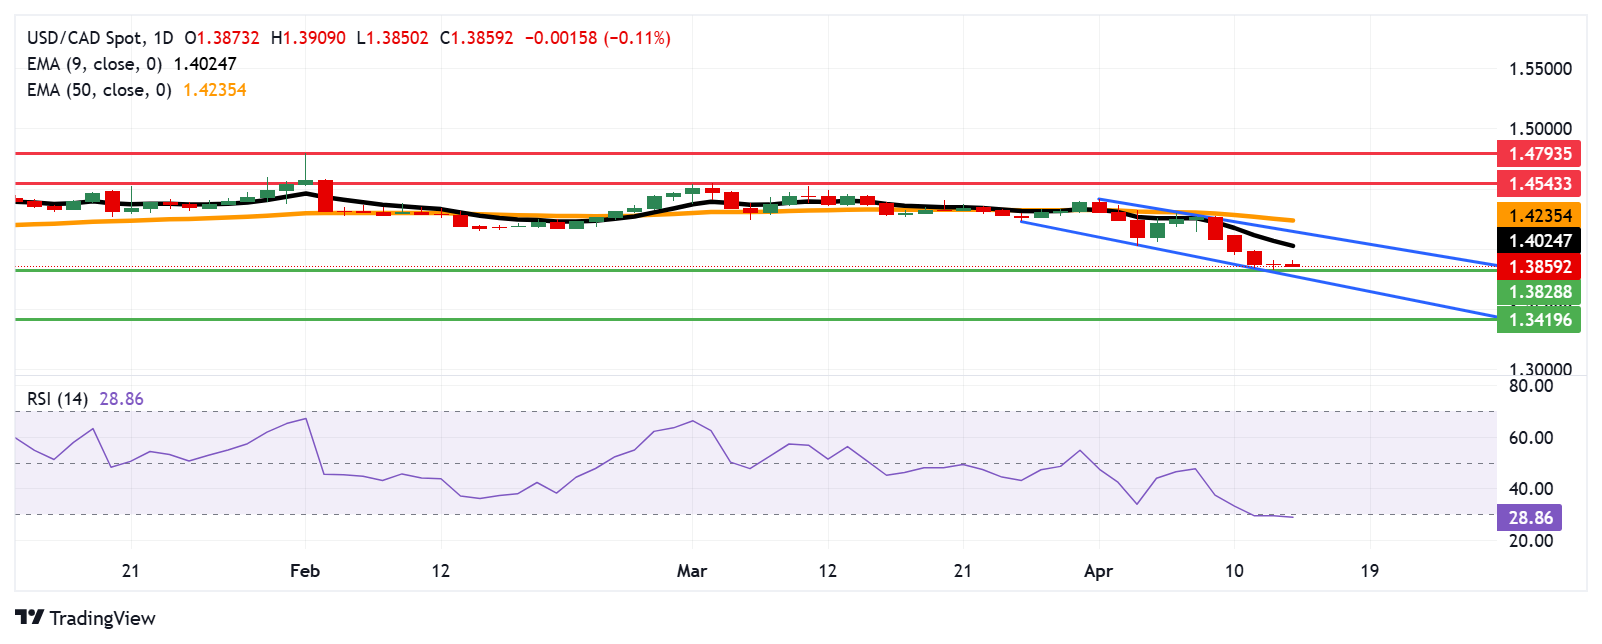
USD/CAD may find support near the six-month low of 1.3828, recorded on Monday.
The 14-day RSI indicates oversold conditions, pointing to the possibility of a short-term rebound.
Initial resistance is positioned at the nine-day EMA around 1.4025, followed by the descending channel’s upper boundary.
The USD/CAD pair extends its decline for the fifth consecutive session, hovering around 1.3860 during European trading on Tuesday. Daily chart technical analysis highlights a dominant bearish trend, with the pair trending lower within a descending channel formation.
Additionally, the USD/CAD pair remains below the nine-day Exponential Moving Average (EMA), signaling weak short-term price momentum. Meanwhile, the 14-day Relative Strength Index (RSI) stays below the 30 level, suggesting the bearish bias is in play but also indicating oversold conditions. This opens the door for potential short-term corrective rebounds.
On the downside, USD/CAD may retest the six-month low of 1.3828, marked on Monday, which coincides with the lower boundary of the descending channel near the 1.3770 level. A decisive break below this channel could reinforce the bearish bias and pave the way for a move toward the 1.3419 area — its lowest point since February 2024.
Initial resistance is seen at the nine-day EMA around 1.4025, followed by the upper boundary of the descending channel near 1.4150. A breakout above this channel could shift the bias to bullish, potentially driving the USD/CAD pair toward the 50-day EMA at 1.4230. Beyond that, further resistance is located at the two-month high of 1.4543, set on March 4.
USD/CAD: Daily Chart
Canadian Dollar PRICE Today
The table below shows the percentage change of Canadian Dollar (CAD) against listed major currencies today. Canadian Dollar was the weakest against the New Zealand Dollar.

The heat map shows percentage changes of major currencies against each other. The base currency is picked from the left column, while the quote currency is picked from the top row. For example, if you pick the Canadian Dollar from the left column and move along the horizontal line to the US Dollar, the percentage change displayed in the box will represent CAD (base)/USD (quote).
Read more
* The content presented above, whether from a third party or not, is considered as general advice only. This article should not be construed as containing investment advice, investment recommendations, an offer of or solicitation for any transactions in financial instruments.


