

USD/CAD Price Analysis: Rises to near 1.3750 nearing lower boundary of rising channel

- Iranian military drones targeted US Fifth Fleet in Bahrain in response to southern US strikes
- Gold Price Trend Forecast: US-Iran Peace Talks Drive Gold Rebound, Is the Gold Slump Over?
- Gold plummets below $4,200 as US‑Iran tensions spur hawkish rate bets ahead of US CPI
- WTI hovers around $80.00 as traders await developments on US-Iran peace talks
- Gold rises to weekly high as US, Iran reach peace deal
- SpaceX Listing Imminent. Funds Flood Into SpaceX On-Chain Tokens, Bitcoin Rebound Momentum May Be Weakened

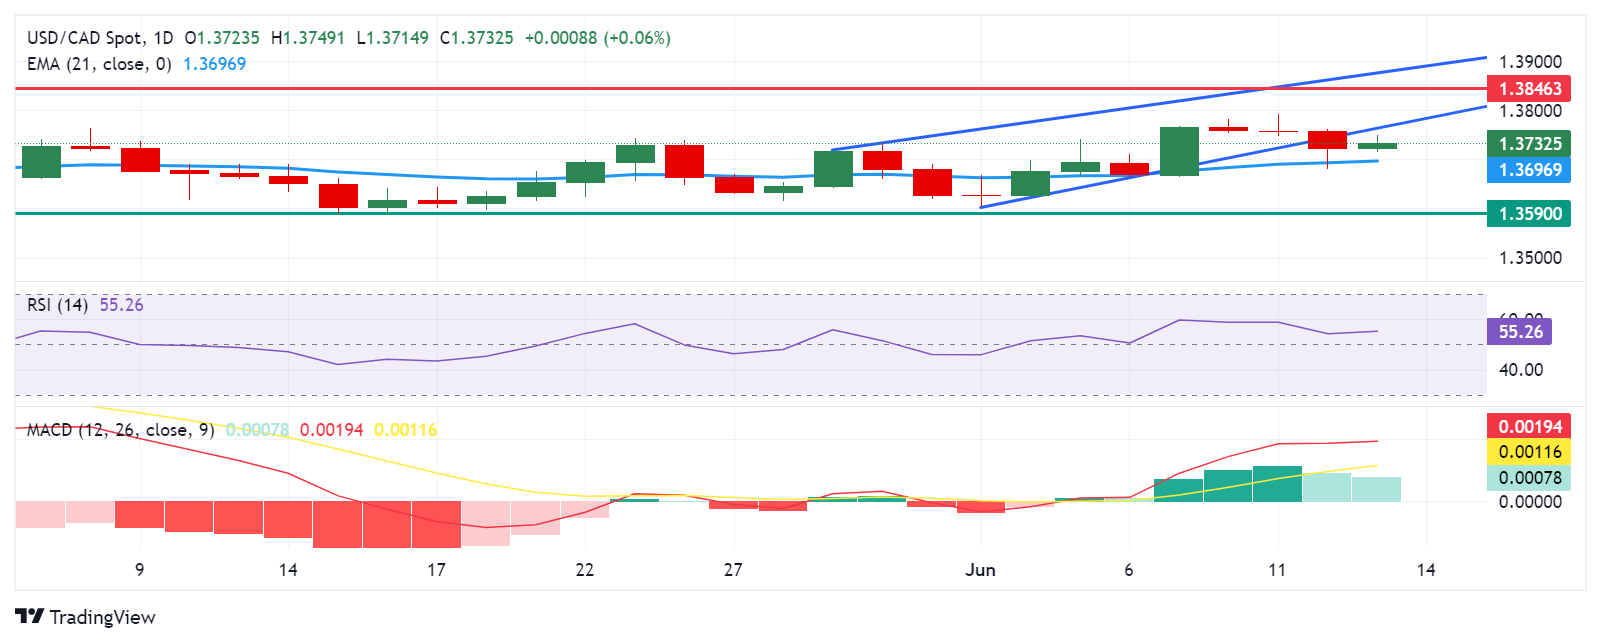
■USD/CAD could test the lower boundary of the rising channel, potentially rebounding to re-enter the rising channel.
■A break below the 50 level on the 14-day RSI could indicate the emergence of a bearish bias.
■The pair may find immediate support at the psychological level of 1.3700 and the 21-day EMA of 1.3697 level.
USD/CAD breaks its three-day losing streak, trading around 1.3730 during the European session on Thursday. Analysis of the daily chart suggests a weakening bullish bias for the USD/CAD pair, as it has broken below the rising channel pattern. However, the 14-day Relative Strength Index (RSI) is still positioned slightly above the 50 level. Further movement may give a clear directional indication.
Additionally, the momentum indicator Moving Average Convergence Divergence (MACD) suggests a bullish trend for the pair as the MACD line is positioned above the centerline, it shows divergence above the signal line.
The USD/CAD pair may test the lower boundary of the rising channel around the level of 1.3760, followed by the key barrier at the psychological level of 1.3800. A return to the rising channel could reinforce the bullish bias and support the pair to explore the region April’s high of 1.3846.
A break above the latter could lead the USD/CAD pair to approach the upper threshold of the rising channel around the level of 1.3870.
On the downside, the USD/CAD pair could find immediate support at the psychological level of 1.3700, aligned with the 21-day Exponential Moving Average (EMA) of 1.3697 level. A break below this level could exert pressure on the pair to navigate the region of the throwback support at 1.3590.
USD/CAD: Daily Chart
Read more
* The content presented above, whether from a third party or not, is considered as general advice only. This article should not be construed as containing investment advice, investment recommendations, an offer of or solicitation for any transactions in financial instruments.


