

USD/CAD faces selling pressure as the US Dollar underperforms in the aftermath of the US NFP data.
Private sector hiring slowed significantly, while public sector hiring proved surprisingly robust.
The imposition of higher tariffs by the US on Canada will dampen the outlook for the Canadian Dollar.
The USD/CAD pair trades lower to near 1.3570 during the European session on Friday, aiming to revisit the eight-month low around 1.3540. The Loonie pair faces selling pressure as the US Dollar (US) gives back its entire gains in the aftermath of the United States (US) Nonfarm Payrolls (NFP) data for June, released on Thursday.
The US Dollar Index (DXY), which tracks the Greenback’s value against six major currencies, slides below 97.00.
According to the NFP report, strong labor hiring by the public sector led to a sharp increase in the overall job data, while private sector hiring slowed significantly. Overall workers added in June were 147K, higher than estimates of 110K. However, job-seekers hired by private employers were 74K, almost half of 137K recorded in May, and way below if compared to the three-month average of 115K.
Although investors have underpinned the Canadian Dollar (CAD) against the US Dollar, it is underperforming other peers amid uncertainty surrounding the July 9 tariff deadline. The Canadian economy has not yet finalized any trade agreement with the US and is likely to face higher tariffs from next week.
Canadian Dollar PRICE Today
The table below shows the percentage change of Canadian Dollar (CAD) against listed major currencies today. Canadian Dollar was the weakest against the Japanese Yen.

The heat map shows percentage changes of major currencies against each other. The base currency is picked from the left column, while the quote currency is picked from the top row. For example, if you pick the Canadian Dollar from the left column and move along the horizontal line to the US Dollar, the percentage change displayed in the box will represent CAD (base)/USD (quote).
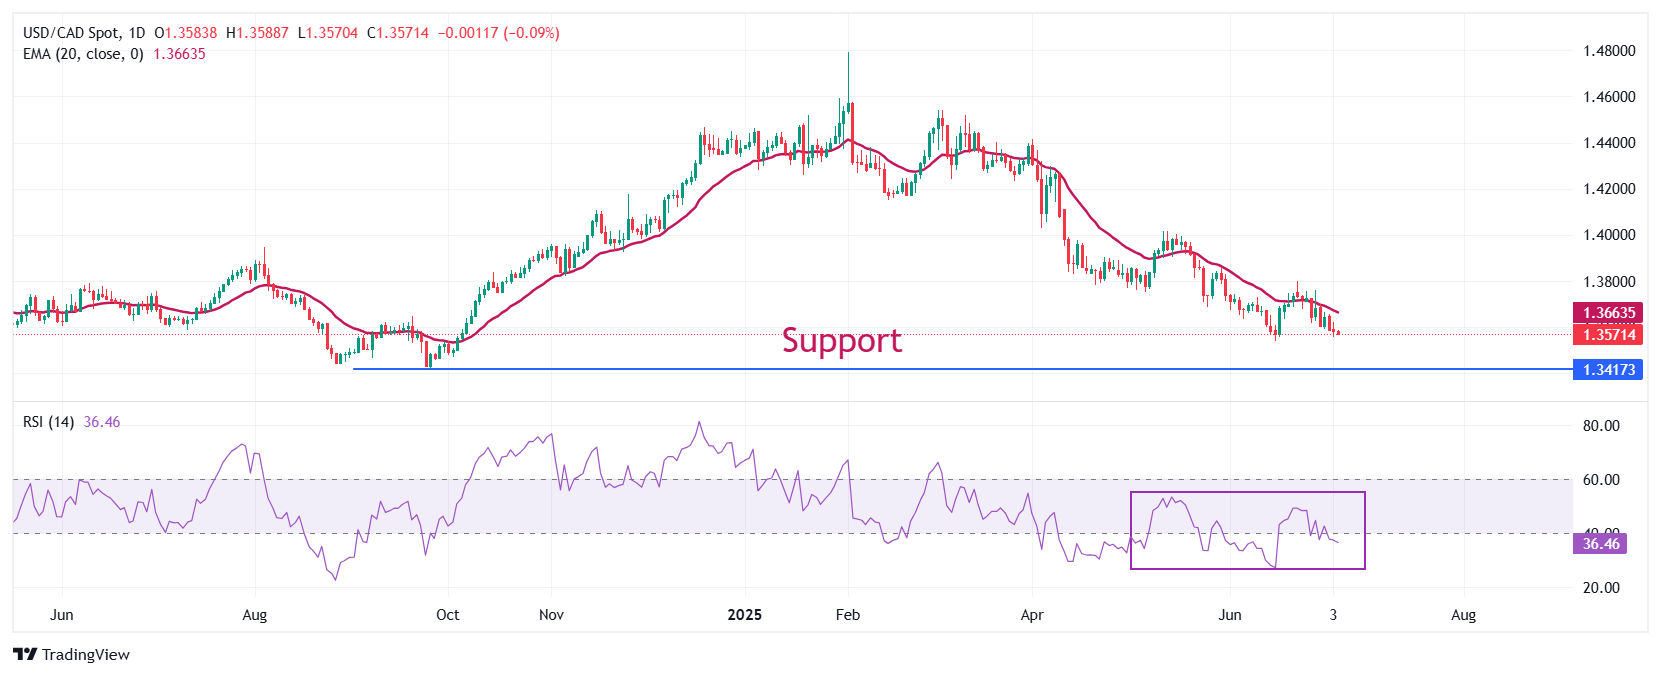
USD/CAD continues to face selling pressure at every attempt above the 20-day Exponential Moving Average (EMA), suggesting a “Sell on Rise” trend. The 14-day Relative Strength Index (RSI) slides below 40.00, suggesting that a fresh bearish momentum has triggered.
Going forward, the asset could slide towards the psychological level of 1.3500 and the September 25 low of 1.3420 if it breaks below the June 16 low of 1.3540.
On the contrary, an upside move by the pair above the May 29 high of 1.3820 would open the door towards the May 21 high of 1.3920, followed by the May 15 high of 1.4000.
USD/CAD daily chart
* The content presented above, whether from a third party or not, is considered as general advice only. This article should not be construed as containing investment advice, investment recommendations, an offer of or solicitation for any transactions in financial instruments.


