

NZD/USD Price Forecast: Remains above 0.5650, resistance appears at nine-day EMA

- Gold Price Trend Forecast: Expectations of Easing US-Iran Tensions Boost Gold Prices, $4,070 Becomes Key Level for Bulls and Bears
- Gold rallies to over two-week high, eyes $4,150 as traders track US-Iran diplomacy efforts
- Euro declines to near 1.1400 as US launches fresh strikes on Iran
- Tesla Q2 Earnings Preview: Record Deliveries Fail to Hide Profit Pressure, Can Musk Rely on AI and Autonomous Driving to Unlock New Growth Space?
- WTI surges above $83.00 amid escalating US-Iran conflict
- WTI climbs above $87.00 as Middle East conflict threatens key choke points

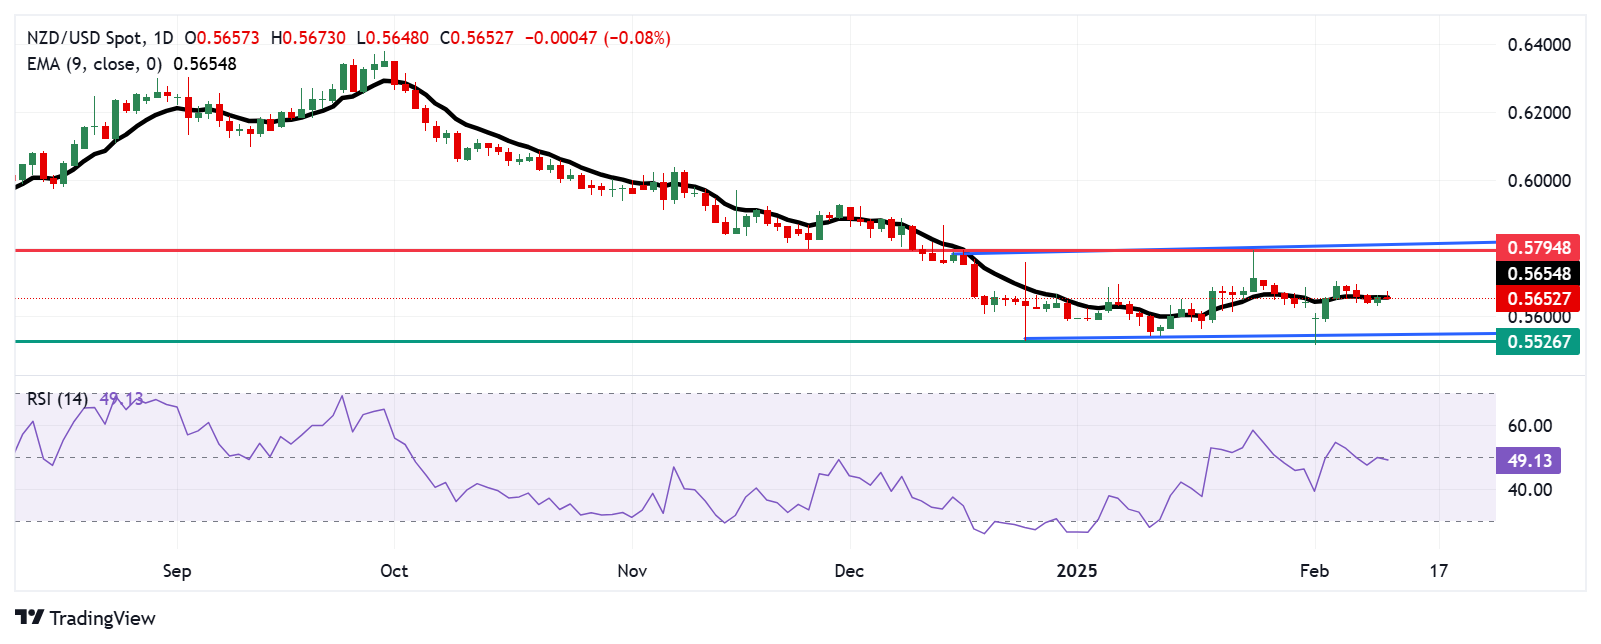
NZD/USD tests the immediate resistance at a nine-day EMA of 0.5654.
Neutral bias prevails as the 14-day RSI remains around the 50 level.
A drop below 0.5650 could push the pair toward the rectangle’s lower boundary at 0.5550.
The NZD/USD pair edges lower after registering losses in the previous session, trading around 0.5650 during the European hours on Wednesday. The daily chart's technical analysis suggests market uncertainty, with buyers and sellers lacking a clear long-term direction as the pair consolidates within a rectangular pattern.
The 14-day Relative Strength Index (RSI) remains near the 50 level, signaling a neutral market stance with no strong buying or selling pressure. A decisive move in either direction could establish a clearer trend. Additionally, the NZD/USD pair continues to trade around the nine-day Exponential Moving Average (EMA), indicating neutral short-term price momentum.
The NZD/USD pair is testing a critical support level at 0.5650. A decisive break below this level could push the pair toward the lower boundary of the rectangle at 0.5550, with further support at 0.5516—its lowest level since October 2022, recorded on February 3.
On the upside, the NZD/USD pair is testing the nine-day EMA at 0.5654. A breakout above this level could strengthen short-term momentum, potentially driving the pair toward its nine-week high of 0.5794, reached on January 24. Beyond this, the next resistance levels lie at the psychological barrier of 0.5800 and the upper boundary of the rectangle at 0.5820.
NZD/USD: Daily Chart
Read more
* The content presented above, whether from a third party or not, is considered as general advice only. This article should not be construed as containing investment advice, investment recommendations, an offer of or solicitation for any transactions in financial instruments.


