

EUR/GBP Price Analysis: Piercing Line candlestick pattern signals short-term reversal after lows

- US President Donald Trump says trade will be priority in summit with Xi, not Iran
- Gold drifts higher to near $4,750 ahead of US CPI inflation release
- Gold slumps below $4,700 on Trump rejection of Iran peace proposal
- Gold edges higher to near $4,700 as Trump-Xi summit looms
- Inflation 'High Fever' Fails to Stop Rally? BTC Temporarily Loses 80,000 Mark, But Arthur Hayes Sees Peak of $126,000
- When Will the Gold Dilemma Be Resolved? Breakdown of US-Iran Negotiations Puts Gold Prices Under Pressure Again, Can It Return to $5,000?
■EUR/GBP sold off to just below 0.8400 as its downtrend unfolds.
■It has formed a bullish Piercing Line Japanese candlestick reversal pattern indicating the potential for a correction higher.
■The pair is in an overall downtrend, however, indicating more downside will probably eventually materialize.
EUR/GBP has sold-off steeply since breaking out of a range-bound consolidation it was trading in for most of the start of the year.
EUR/GBP Daily Chart
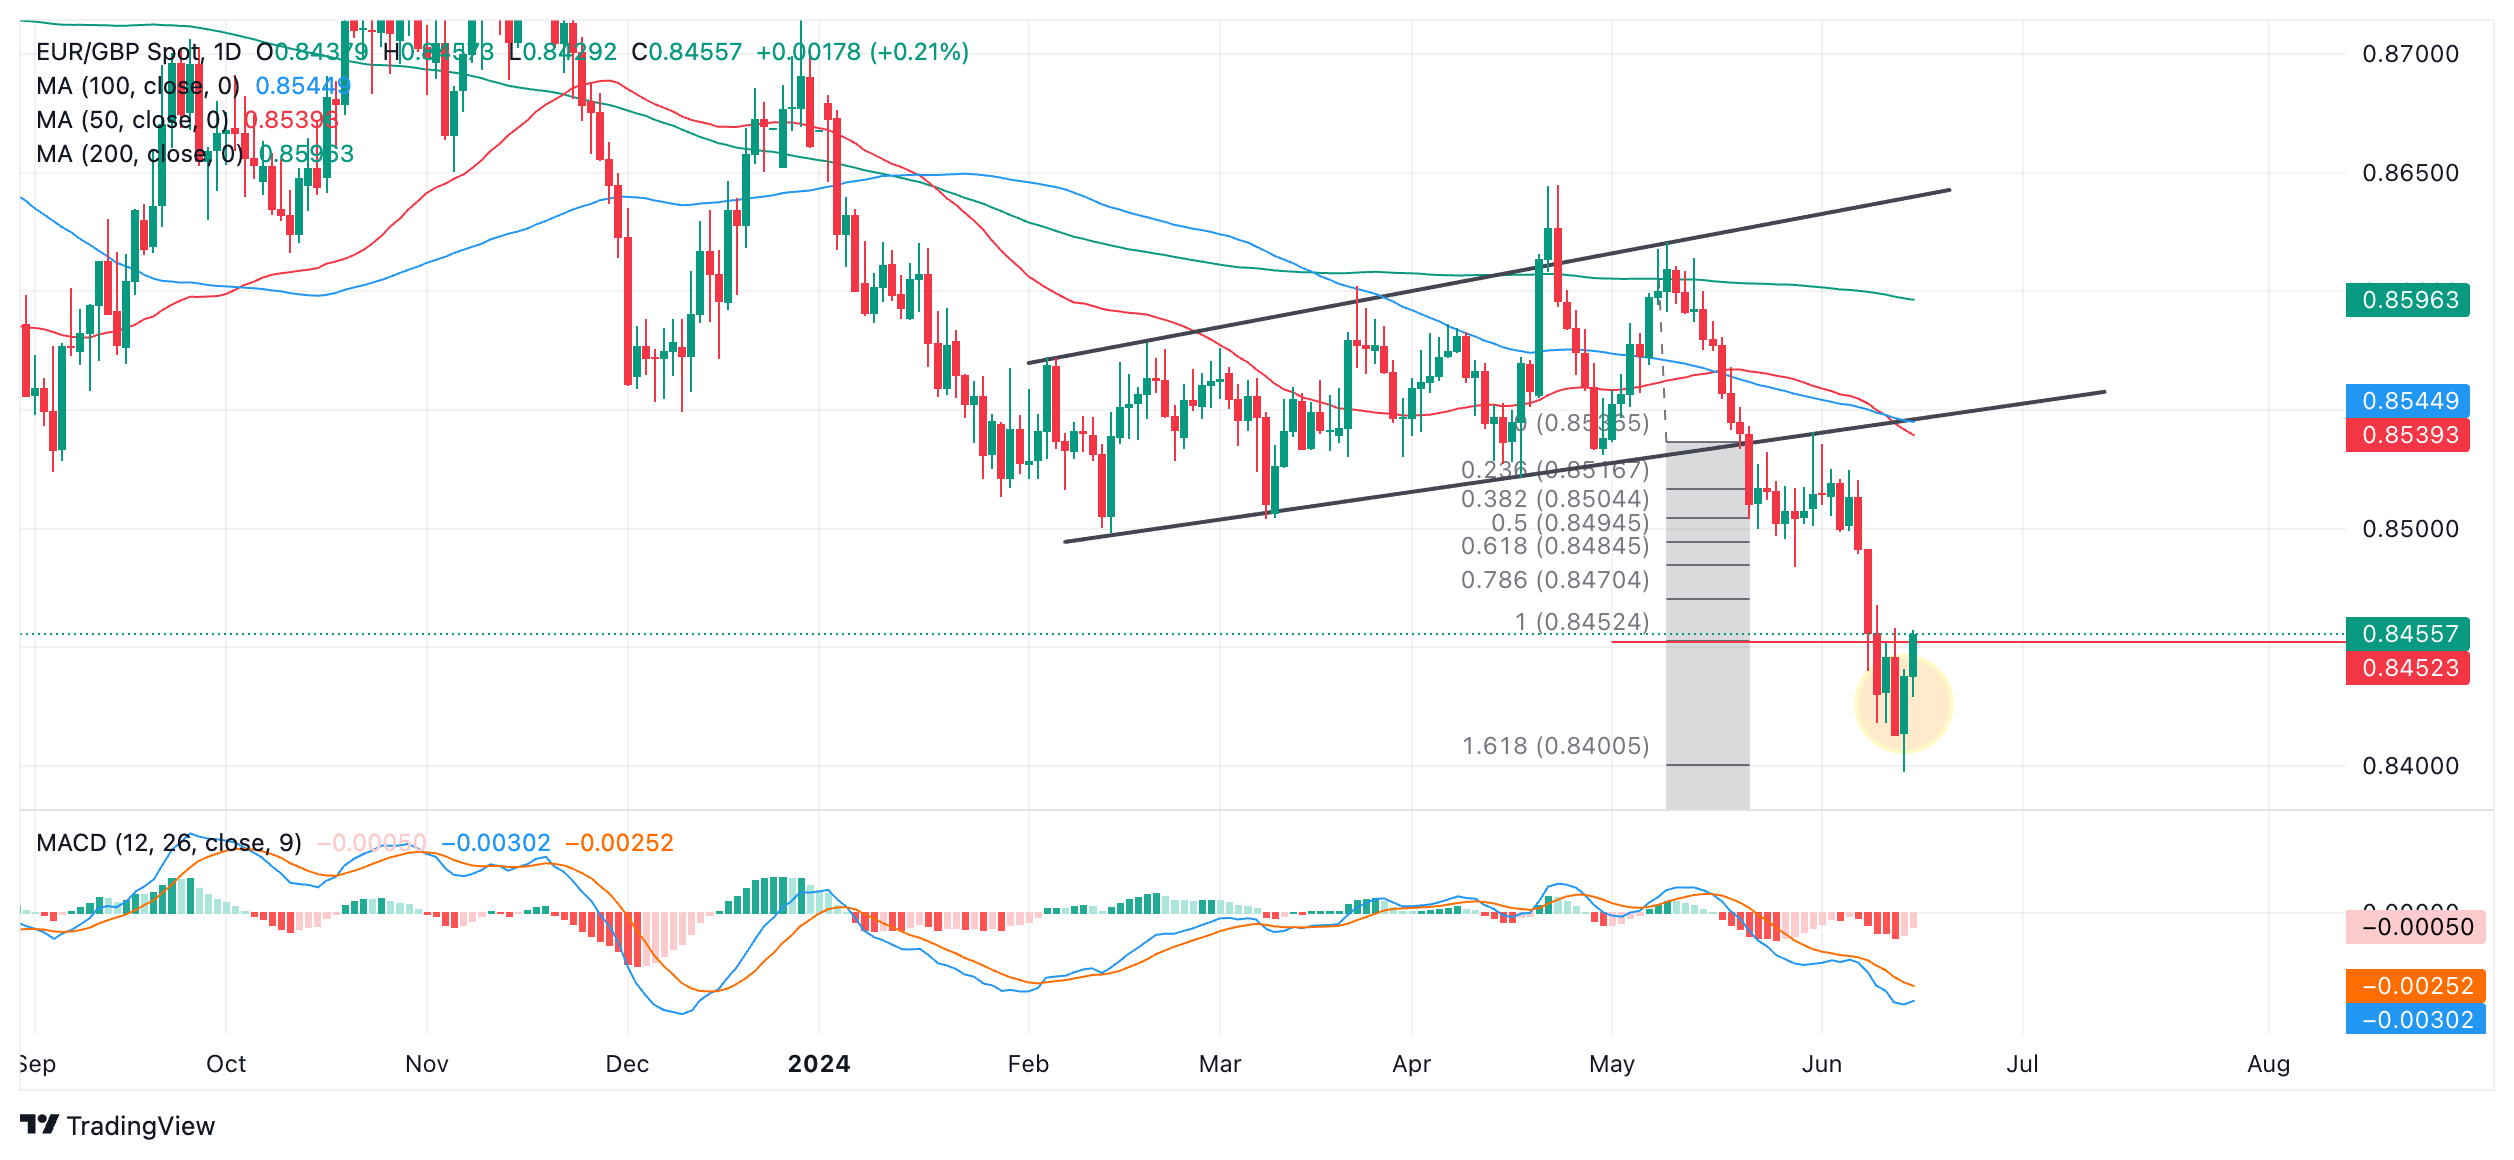
After touching a low at 0.8398 on June 1 4 it reversed and started rising, forming a Japanese Piercing Line candlestick reversal pattern in the process (circled). This occurs when price falls to a new low and then rotates higher during the same day, closing at a level above the halfway mark of the previous day’s body. The Piercing Line has been followed by a green up day today (Monday) and if it closes positive then it will provide added bullish confirmation of the reversal. The pattern suggests a short-term reversal but not a reversal of the trend. It could mean EUR/GBP is about to correct higher.
The trend, both on a short, intermediate and long-term basis is bearish on balance. Given “the trend is your friend” this suggests the correction will probably run out of steam and roll over eventually, with the dominant downtrend then resuming.
Price has reached both the conservative and main target for the breakout from the range that evolved during February, March, April and half of May.
Continued weakness could see it fall to the next downside target at 0.8340 (August 2022 low). A break below the 0.8397 (June 14 low) would provide confirmation of more downside.
Read more
* The content presented above, whether from a third party or not, is considered as general advice only. This article should not be construed as containing investment advice, investment recommendations, an offer of or solicitation for any transactions in financial instruments.


