

Solana started a fresh decline from the $188 zone. SOL price is now moving lower and might decline further below the $170 level.
SOL price started a fresh decline from the $188 resistance zone against the US Dollar.
The price is now trading below $180 and the 100-hourly simple moving average.
There is a connecting bearish trend line forming with resistance at $176 on the hourly chart of the SOL/USD pair (data source from Kraken).
The pair could start a fresh increase if it clears the $180 resistance zone.
Solana Price Dips Again
Solana price formed a base above the $170 support and started a fresh increase, like Bitcoin and Ethereum. SOL gained pace for a move above the $172 and $175 resistance levels.
The price tested the $188 resistance before there was a fresh drop to $170. A low was formed near $170 and the price recently attempted a fresh increase. The price cleared the $172 level. It surpassed the 23.6% Fib retracement level of the recent decline from the $188 swing high to the $170 low.
Solana is now trading below $180 and the 100-hourly simple moving average. There is also a connecting bearish trend line forming with resistance at $176 on the hourly chart of the SOL/USD pair.
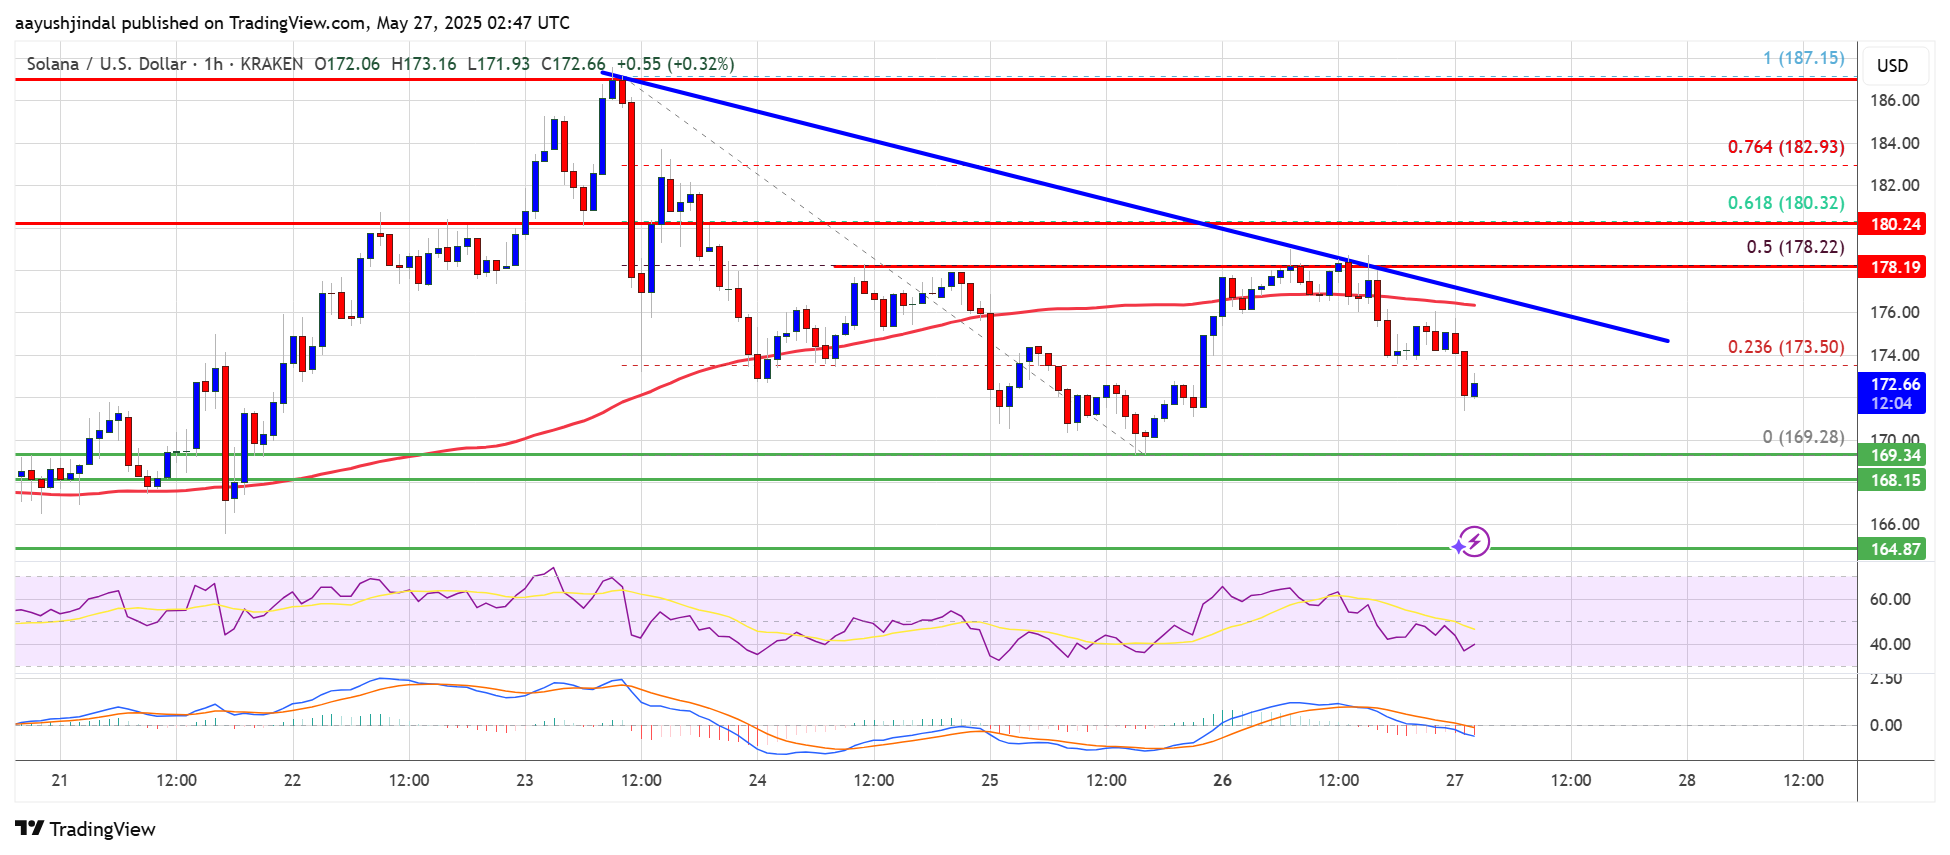
On the upside, the price is facing resistance near the $176 level. The next major resistance is near the $180 level. The main resistance could be $185. A successful close above the $185 resistance zone could set the pace for another steady increase. The next key resistance is $192. Any more gains might send the price toward the $200 level.
Another Decline in SOL?
If SOL fails to rise above the $176 resistance, it could start another decline. Initial support on the downside is near the $172 zone. The first major support is near the $170 level.
A break below the $170 level might send the price toward the $165 zone and the trend line. If there is a close below the $165 support, the price could decline toward the $160 support in the near term.
Technical Indicators
Hourly MACD – The MACD for SOL/USD is gaining pace in the bearish zone.
Hourly Hours RSI (Relative Strength Index) – The RSI for SOL/USD is below the 50 level.
Major Support Levels – $172 and $170.
Major Resistance Levels – $176 and $180.
* The content presented above, whether from a third party or not, is considered as general advice only. This article should not be construed as containing investment advice, investment recommendations, an offer of or solicitation for any transactions in financial instruments.


