
Stellar Price Forecast: XLM derivatives data hint at double-digit rally as bullish bets surge

Stellar price hovers around $0.242 on Thursday, having recovered nearly 6% so far this week.
Derivatives data indicate rising confidence as XLM’s funding rates turn positive and bullish bets are rising.
The technical outlook suggests a possible double-digit gain if it closes above the $0.253 resistance level.
Stellar (XLM) is hovering around $0.242 at the time of writing on Thursday, having recovered nearly 6% so far this week. The derivatives data suggest rising investor confidence as XLM’s funding rate turns positive and the bullish bets reach their highest level in over a month. The technical outlook shows that a daily close above the $0.253 resistance could trigger a double-digit rally.
Stellar eyes breakout as derivatives signal bullish momentum
Stellar’s Coinglass long-to-short ratio reads 1.11 on Thursday, the highest level in over a month. This ratio, above one, reflects bullish sentiment in the markets, as more traders are betting on the XLM price to rise.
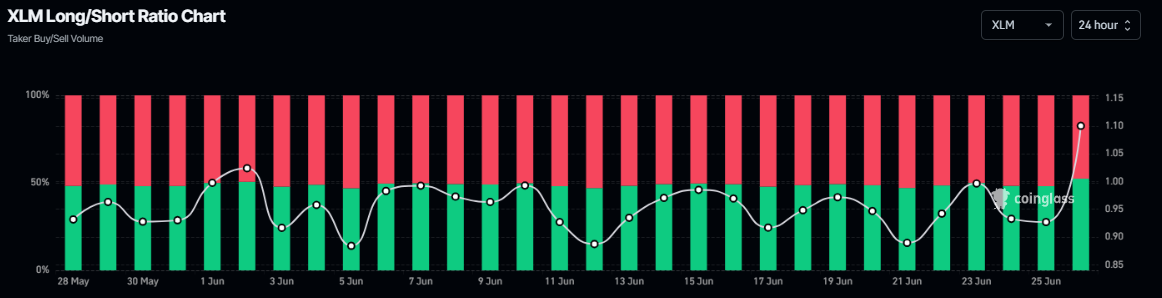
XLM long-to-short ratio chart. Source: Coinglass
Another bullish sign for XLM is that its funding rates data turned positive on Thursday. CoinGlass’s OI-Weighted Funding Rate data shows that the number of traders betting that the price of XLM coin will slide further is lower than that anticipating a price increase. Generally, a positive rate (longs pay shorts) indicates bullish sentiment, while negative numbers (shorts pay longs) indicate bearishness.
The metric has flipped to a positive rate and reads 0.0007% on Wednesday, indicating that longs are paying shorts. Generally, as shown in the chart below, when funding rates have flipped from negative to positive and have remained positive, the XLM price has rallied sharply.
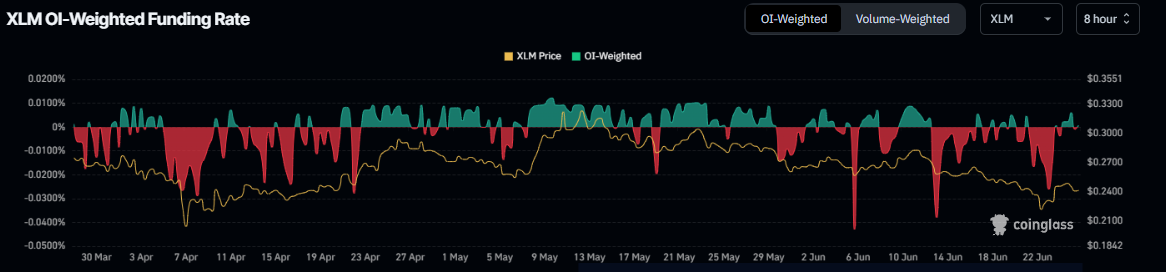
Stellar’s OI-Weighted Funding Rate chart. Source: Coinglass
Stellar Price Forecast: XLM on the verge of a breakout
Stellar price closed below the daily support at $0.253 last week and declined by 11.52%, subsequently retesting the weekly support on Sunday. However, at the start of this week, it recovered 8.6% until Tuesday but faced a slight correction the next day. At the time of writing on Thursday, it hovers around $0.241.
If XLM recovers, breaks, and closes above the daily resistance at $0.253, it could extend the rally by 12% from the daily level to retest its high of $0.285.
The Relative Strength Index (RSI) reads 40 after recovering from its overbought conditions this week, indicating fading bearish momentum. However, for the bullish momentum to be sustained, the RSI must move above its neutral level of 50 to initiate a recovery rally. The Moving Average Convergence Divergence (MACD) is hinting at a bullish crossover (the MACD line is close to crossing above the signal line), which, if completed, would give a buy signal.
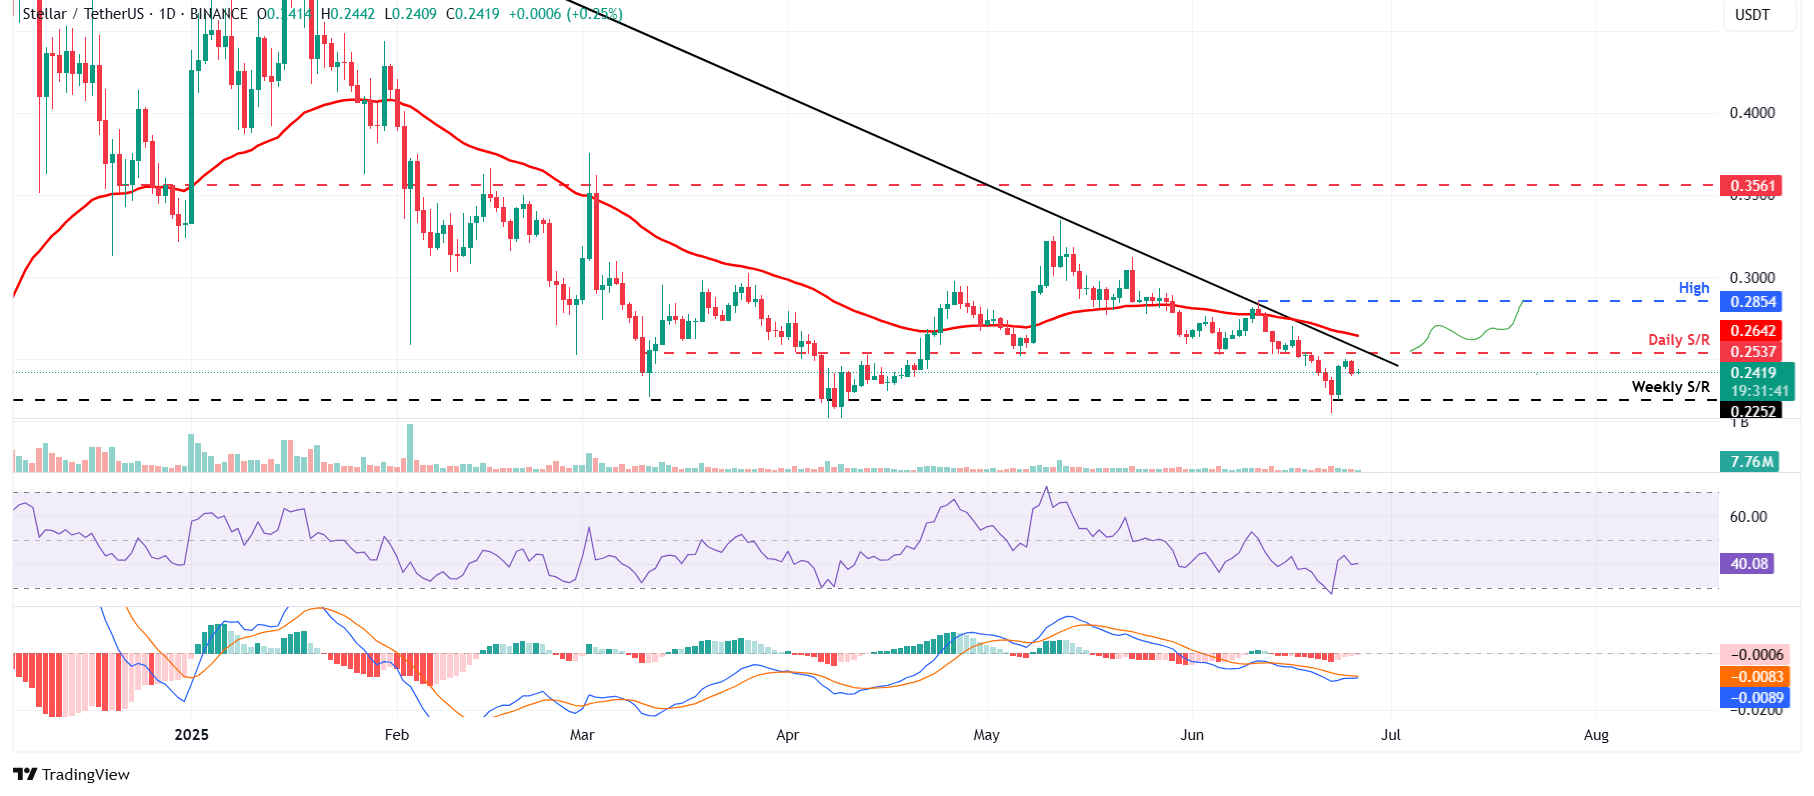
XLM/USDT daily chart
However, if XLM faces a correction, it could extend the decline to retest its weekly support at $0.225.
* The content presented above, whether from a third party or not, is considered as general advice only. This article should not be construed as containing investment advice, investment recommendations, an offer of or solicitation for any transactions in financial instruments.


