
Quant Price Forecast: QNT poised for next leg higher as buy-side pressure builds


Quant price holds steady near $100.70 on Thursday after rebounding from a key support level earlier this week.
On-chain metrics highlight bullish momentum, with QNT’s Spot Taker CVD turning positive and trending upward.
Robinhood EU expands crypto offerings, enabling European users to trade QNT tokens.
Quant (QNT) price is stabilizing near $100.70 on Thursday after rebounding from a key support level earlier this week. On-chain data reinforces the bullish outlook, with QNT’s Spot Taker Cumulative Volume Delta (CVD) turning positive and trending upward, signaling increased buy-side dominance. Adding to the positive sentiment, Robinhood EU has announced that its European customers can now access QNT trading, potentially expanding the token’s investor base.
Quant bulls take control of the momentum
CryptoQuant data, as shown in the graph below, highlights buying pressure on Quant. The Taker CVD (Cumulative Volume Delta) for QNT has been positive, has increased since mid-April, and is reaching levels not seen since February. This indicator measures the cumulative difference between market buy and sell volumes over 3 months. When 90-day CVD is positive and increasing, it suggests the Taker Buy Dominant Phase, while a negative and decreasing value indicates the Taker Sell Dominant Phase.
-1747287707941.png)
QNT Spot Taker CVD chart. Source: CryptoQuant
On Monday, Robinhood Crypto EU announced that it is expanding crypto offerings, enabling European users to trade QNT tokens. It also added Solana blockchain memecoins Popcat (POPCAT) and Peanut the Squirrel (PNUT).
Listing these tokens is a positive catalyst that will likely drive short-term price increases due to increased visibility and retail investor access. However, the longevity of these price movements depends on sustained trading volume, community engagement, and broader market conditions.
Quant Price Forecast: QNT rebounds from key support level
Quant price retested and found support around the daily level at $94.3 on Tuesday, and rebounded the next day. At the time of writing on Thursday, it hovers around $100.7.
If QNT holds above the daily support at $94.3, it could extend the rally to retest its 50% price retracement level (drawn from the December high of $171.7 to the April low of $59.2) at $115.4.
The Relative Strength Index (RSI) on the daily chart reads 71 above its overbought level of 70, pointing upwards, indicating strong bullish momentum. However, traders should be cautious as the chances of a pullback are high due to the overbought condition. Another possibility is that the RSI remains above the overbought level of 70 and continues its upward trend.
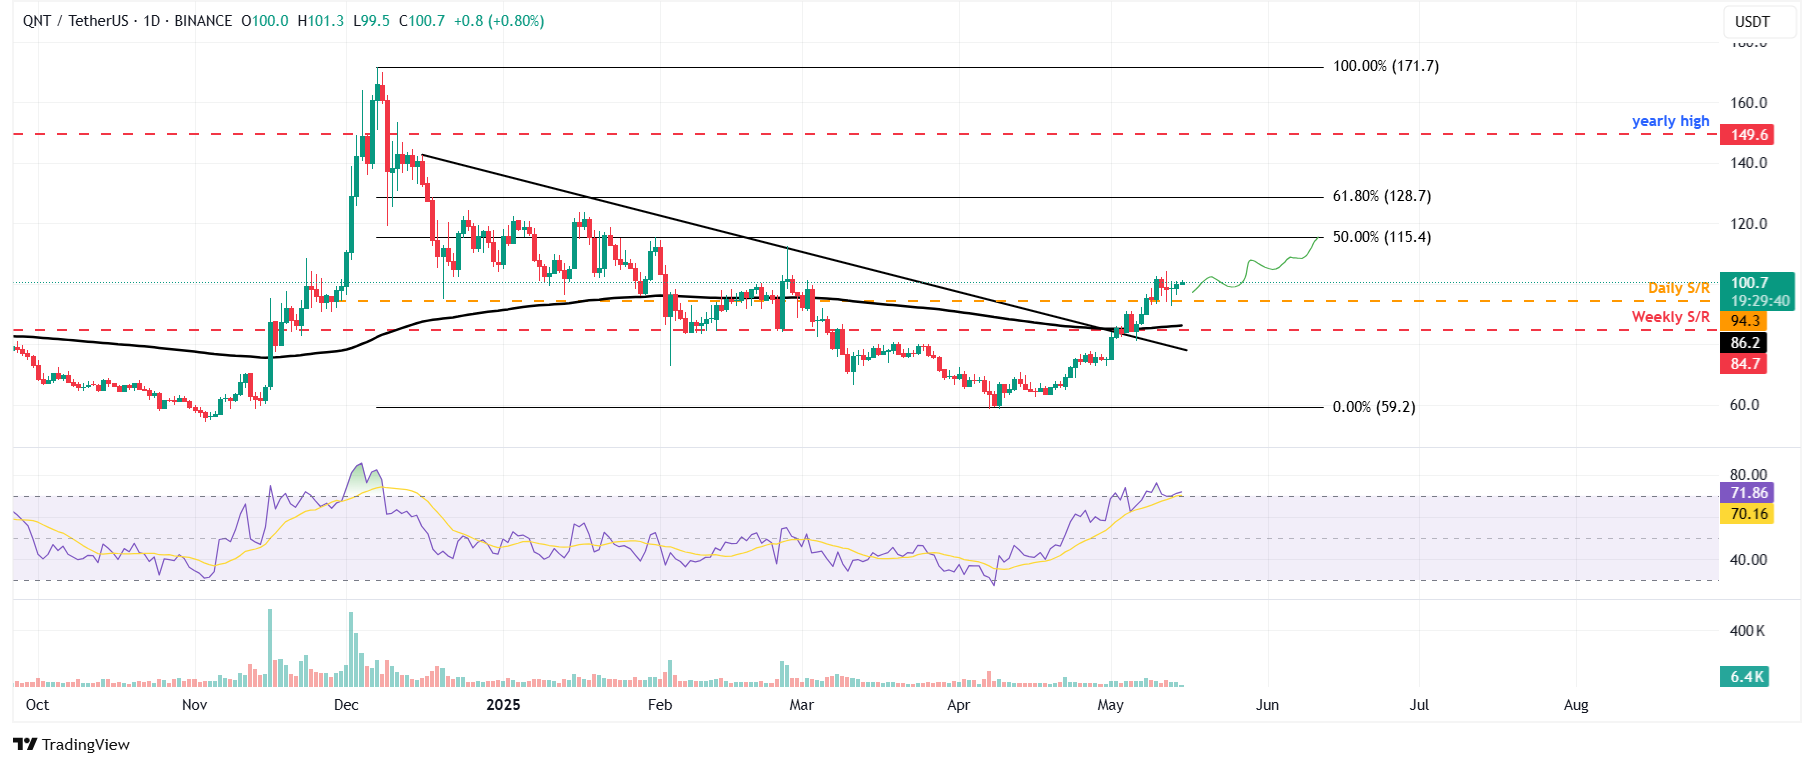
QNT/USDT daily chart
However, if QNT closes below $94.3, it would extend the decline to retest its next weekly support at $84.2.
* The content presented above, whether from a third party or not, is considered as general advice only. This article should not be construed as containing investment advice, investment recommendations, an offer of or solicitation for any transactions in financial instruments.


