

Tellor Price Skyrockets by 700% - Will TRB Continue to Surge?

- Gold Price Forecast: Gold Poised to Break $4,200 as Oil Price Slump Eases Inflation Fears
- Gold declines despite easing concerns over inflation, interest rate hikes
- Fed Decision Eve: 104 Economists Expect No Change; Why Is Citadel Securities Betting on a Surprise Hike?
- Gold Price Forecast: Can Gold Hold $4,020 as Fed Rate Hike Expectations Rise?
- Middle East War updates: US-Iran pause strikes as Trump weighs up diplomatic options
- WTI Oil flirts with the $80 level amid speculation about US-Iran peace talks

Starting from the end of August, Tellor (TRB) has experienced a continuous surge from around $10 to a high of nearly $80, marking an increase of almost 700%.
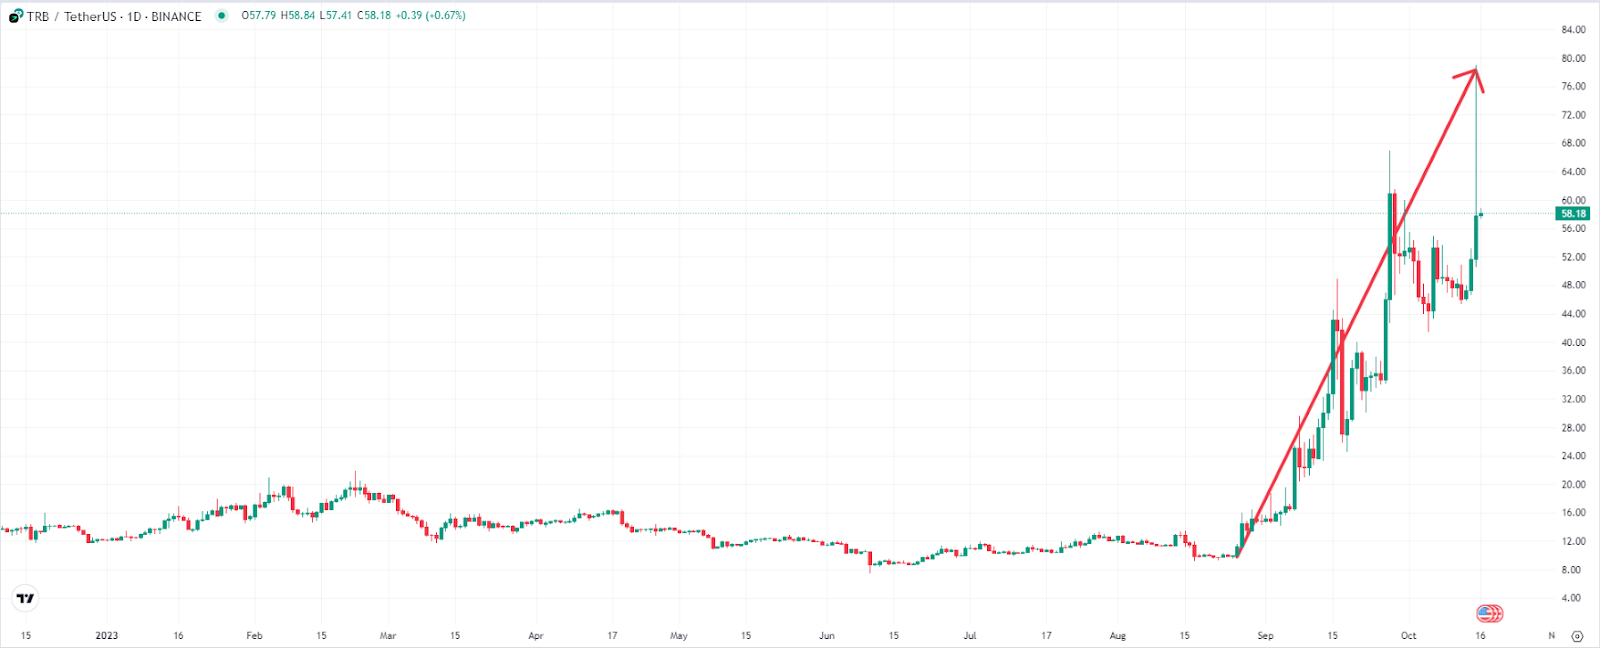
TRB Daily Price Chart, Source: TradingView.
After being constrained by a bearish technical pattern for nearly three weeks, Tellor (TRB) has now broken free. Although seasoned traders anticipated this trend, the rapid price surge has affected some of them, causing them to reassess their profit-taking levels.
Over the weekend, the price continued to outperform BTC, ETH, and the entire cryptocurrency market, surging by 30% in the past 24 hours. Based on technical indicators, the rally may not be overextended as the Relative Strength Index (RSI) is still trending upward, and the Accelerator Oscillator (AO) remains in positive territory.
As a result, the Tellor price may continue to rise, clearing the immediate resistance at $66.95. In a highly bullish scenario, TRB's gains may retrace the intraday high of $79.00, representing an increase of approximately 30% from current levels.
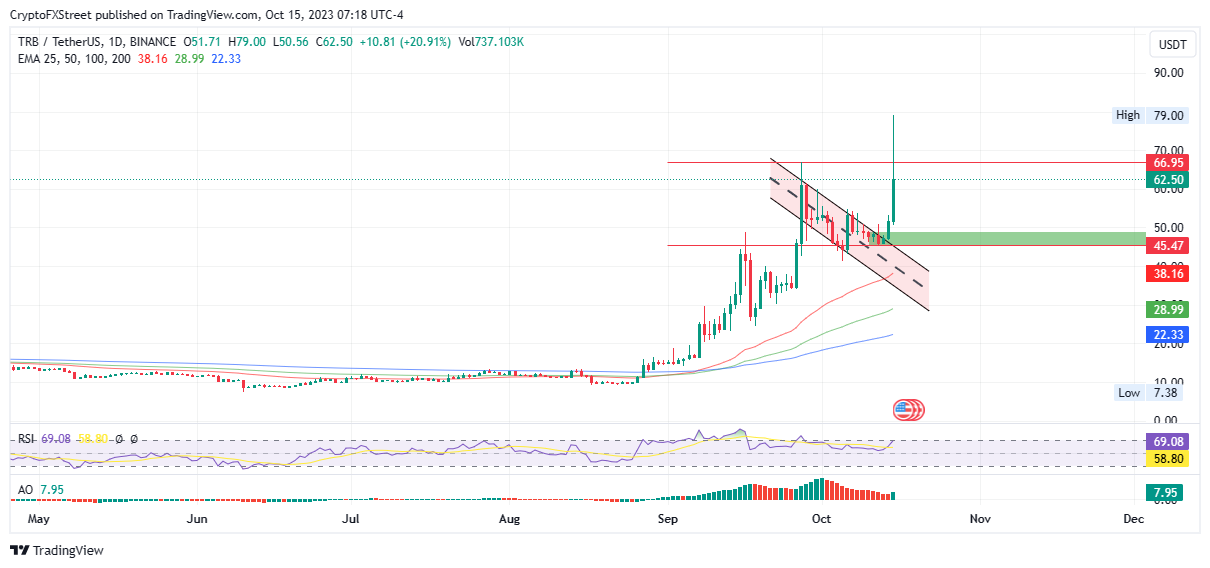
TRB/USDT 1-day chart, Source: TradingView.
Conversely, if profit-takers join the bearish camp, there is a higher probability of a price decline for Tellor. It could potentially drop into the range of $49.09 to $45.21. If the closing price of TRB falls below the support level of $45.47, the bullish outlook will be invalidated.
In the most severe case, the downtrend could continue to the confluence of the channel's midline and the 50-day Exponential Moving Average (EMA) at $38.16, resulting in a 40% drop compared to current levels.
Read more
* The content presented above, whether from a third party or not, is considered as general advice only. This article should not be construed as containing investment advice, investment recommendations, an offer of or solicitation for any transactions in financial instruments.


