

Solana price fails to break trend with longs likely to suffer

- Silver Price Forecast: Trump Signals Rapid Progress in US-Iran Negotiations, Bulls Target $90
- Gold declines below $4,500 as Iran tensions stoke inflation fears and bolster Fed hike bets
- Fed’s Powell says credibility lost if President can fire officials
- $1.5 Billion in Crypto Assets Liquidated, Bitcoin Falls Below $66,000 Mark. What Is the Reason?
- Bitcoin Suffers Year’s Strongest Waterfall-Style Decline. Will It Next Drop to the $60,000 Mark?
- WTI rises to near $93.00 as Iran launches missiles toward Kuwait, Bahrain
Recently, the price of Solana (SOL) has remained trapped in a bearish technical setup and may continue to decline unless there is a market recovery in bullish sentiment. The situation could have been worse if not for the court-allowed liquidation of $3.6 billion in cryptocurrency from FTX exchange.
On September 16th, during an attempt by the bulls to break free from a descending parallel channel, the price of Solana (SOL) was suppressed by the 21-day Exponential Moving Average (EMA) at $19.51.
Currently, Solana, the "Ethereum killer," is still stuck in a bearish technical pattern and may continue to decline as long as it remains within its range.
The overall outlook suggests an imminent price drop for Solana, indicated by the Relative Strength Index (RSI) showing a downward momentum. The Accelerator Oscillator (AO) is also in the negative territory, adding credibility to the bearish scenario.
Increasing selling pressure could lead SOL to test the midline of the channel near the psychological level of $18.00. In more severe cases, the price of Solana may extend its downward trend towards the lower limit of the channel at $17.29.
In the worst-case scenario, the downtrend could push the Solana price into a demand area marked by the last candle before the start of the upward trend in July. This region is predominantly driven by buyers and could serve as a turning point for SOL.
However, if SOL fails to hold its support level, a breakout could act as a bearish trigger, widening the losses for Solana and potentially reaching the support level at $14.49.
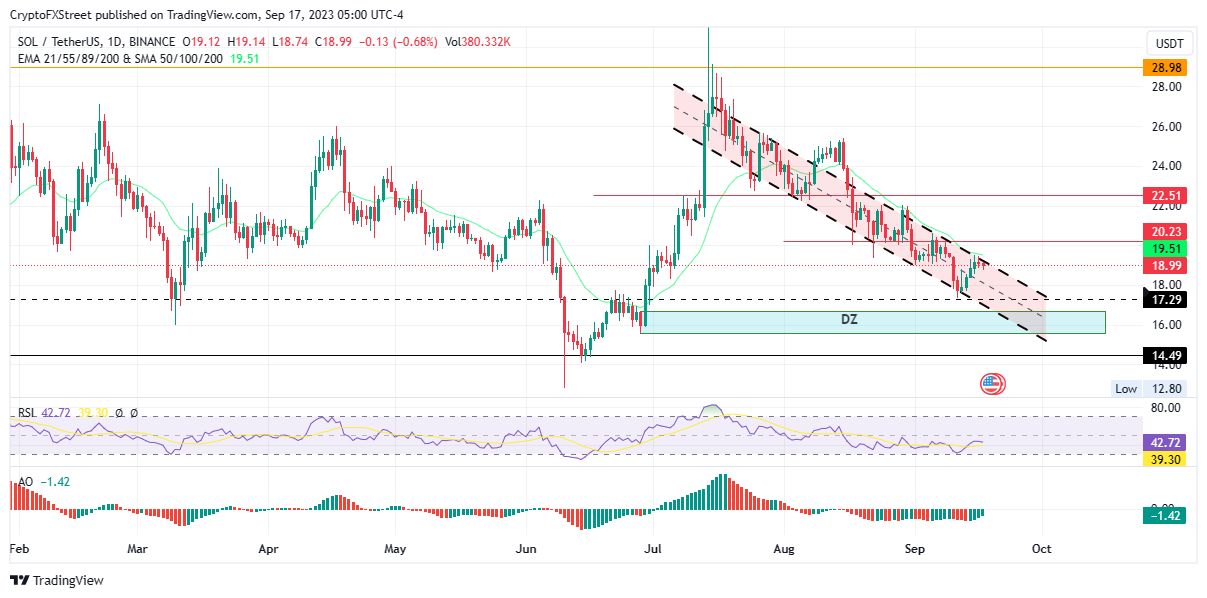
SOL/USDT 1-day Price Chart, Source: TradingView.
Liquidation data from CoinGlass shows that the number of liquidated bullish positions is forty-five times greater than bearish positions.
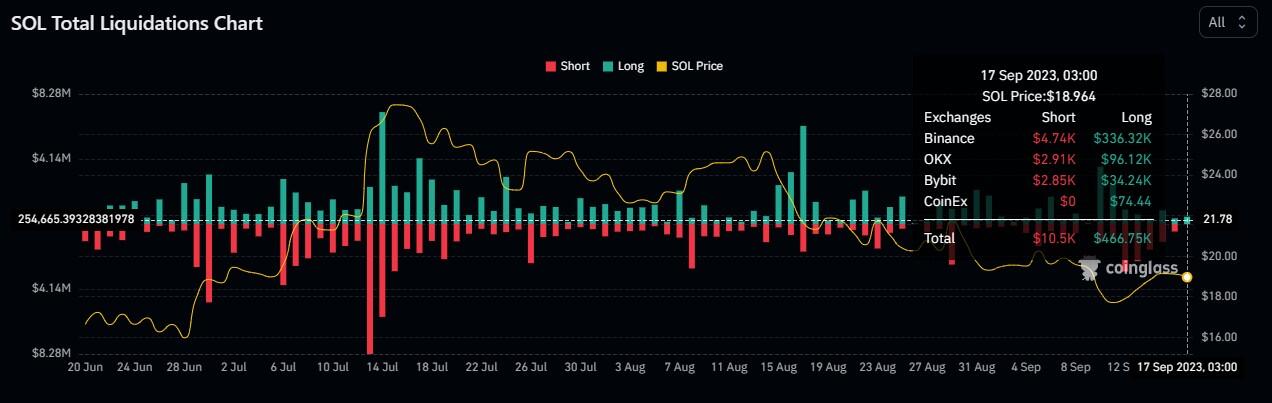
SOL Liquidation, Source: CoinGlass.
On the other hand, buying pressure is increasing above the current level (signaled by a breakout above the channel's upper limit), and if the Solana price surpasses the 21-day moving average at $19.51, it could pave the way for an upward trend, confirmed by a decisive closing price above $20.23.
* The content presented above, whether from a third party or not, is considered as general advice only. This article should not be construed as containing investment advice, investment recommendations, an offer of or solicitation for any transactions in financial instruments.


