Is Bitcoin Heading For A Bear Market? Analysts Weigh In On The Price Struggles

Mitrade
Trending Articles
coverImg
Source: DepositPhotos

Bitcoin market performance has been underwhelming since its peak above $73,000 in March 2024. Instead of building on this rally, the top crypto has faced continued consolidation coupled with a series of declines, frustrating many investors.


Currently, Bitcoin is down 22.7% from its March high, raising concerns over whether this signals the start of a deeper bear market. The decline has shaken confidence, with market analysts now questioning the near-term outlook for the digital asset.


Bitcoin Price Continous To Struggle, Why?


Analysts from IntoTheBlock, a market intelligence platform, have recently shared insights on X, reflecting the changing sentiment. In a post uploaded earlier today, the analyst noted:


Bitcoin’s price remains under pressure, with no significant upward momentum. The market, once hopeful for a rally, now faces growing uncertainty as both retail and institutional interest appear to be dwindling.


The analysts asked, “is this just a quiet phase or the start of a prolonged bear market?”


To answer this question, IntoTheBlock first assessed Bitcoin price struggles and the factors contributing to the lackluster price movement.


Mentioning “macro landscape,” the market intelligence platform disclosed that the possibility of a global recession looms large, creating a cautious outlook for risk assets like Bitcoin.


They noted that although many expect rate cuts soon, these measures may take time to affect Bitcoin and other cryptocurrencies positively. Meanwhile, until that happens, the broader macro environment will likely continue to pressure market sentiment and investor confidence.


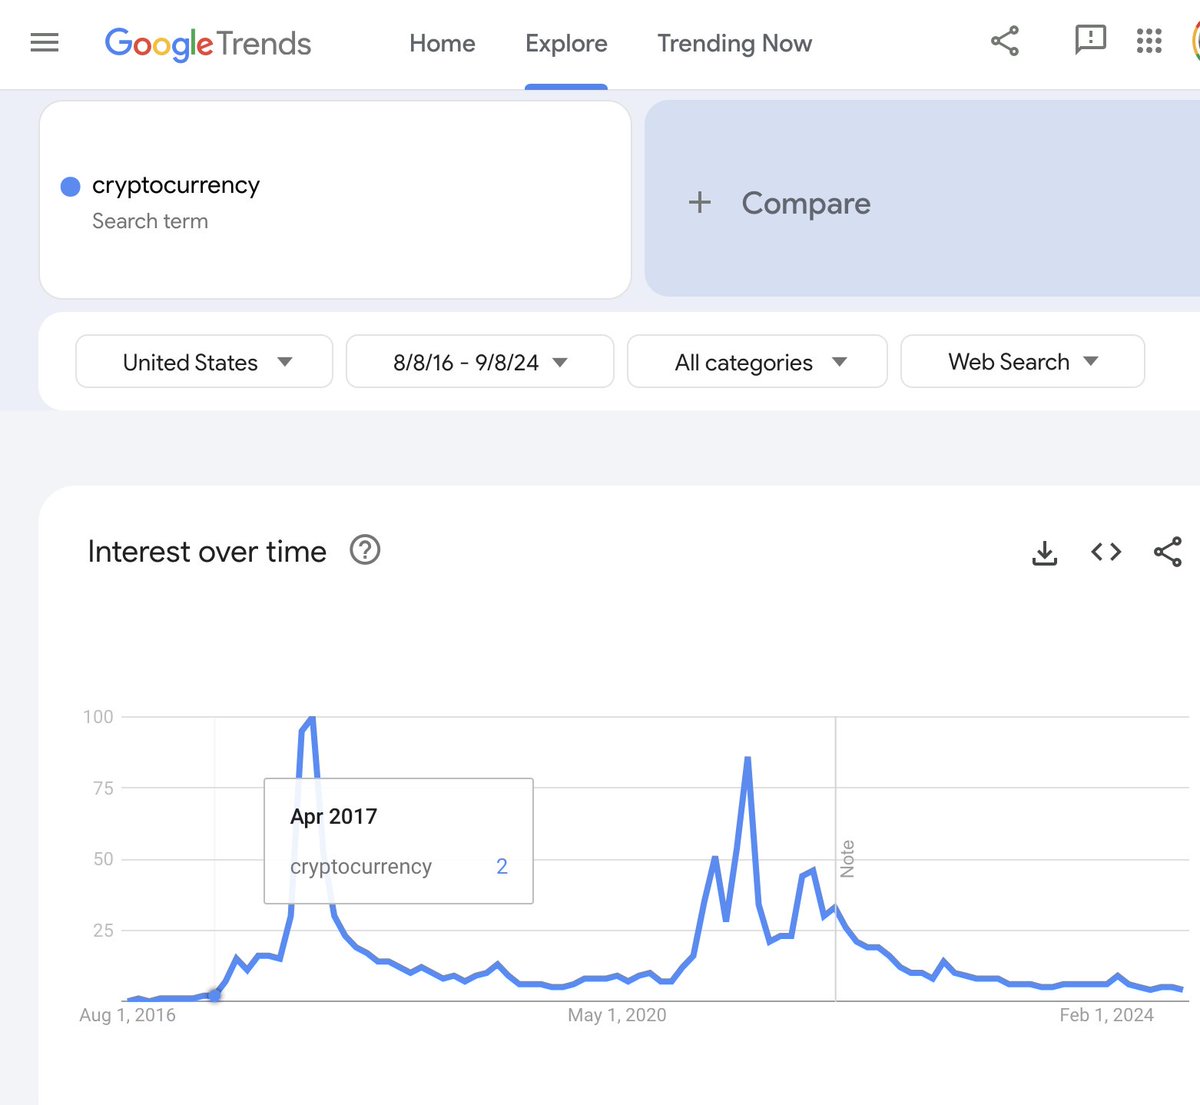
Furthermore, IntoTheBlock touched on the interest in cryptocurrencies, which has also been declining sharply in recent months.


According to the market intelligence platform, search trends related to Bitcoin and other digital assets have significantly decreased, reflecting a drop in public interest.

Search trend for cryptocurrency plummets on Google.

Even app rankings for major crypto exchanges like Coinbase have fallen, suggesting fewer users engage with the market. This trend has extended to on-chain metrics, where the number of new Bitcoin addresses remains low, indicating a slowdown in market participation.


Should You Panic?


While the current downturn has raised concerns, analysts from IntoTheBlock see potential parallels to Bitcoin’s price action in 2019. They noted:


Historical Bitcoin halving cycles suggest it could be a post-halving dip, something we’ve seen before. Parallels to 2019: Interestingly, many analysts point out the current phase mirrors 2019, where the market also slowed down after a (local) high. Back then, the market experienced a prolonged consolidation before turning bullish again. Could we be on the same path?


IntoTheBlock further highlighted that “other cycle data tells a different story.” The market intelligence platform noted that in recent weeks, the balances of long-term Bitcoin holders have hit new lows, echoing post-peak trends from previous market cycles.

Bitcoin long-term holders.

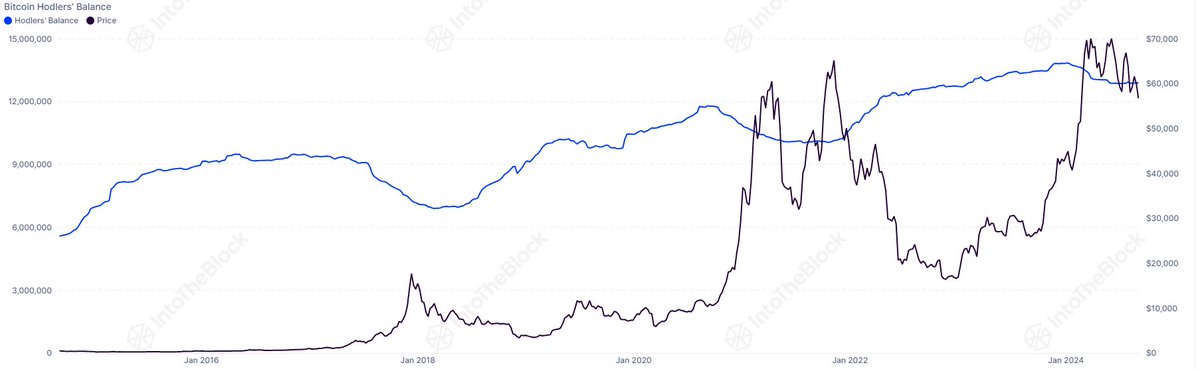
According to IntoTheBlock, this could signal a “prolonged cooldown” phase for Bitcoin, potentially delaying any significant price recovery.


The analysts noted that while the market faces uncertainties, there are no definitive answers. They concluded:


There are no clear-cut answers, but by considering past cycles and current data, we can stay open to possibilities Keep track of both on-chain data and macro factors—they will be critical in determining what comes next

Bitcoin (BTC) price chart on TradingView

Featured image created with DALL-E, Chart from TradingView

Read more

  • December Santa Claus Rally: New highs in sight for US and European stocks?
  • * The content presented above, whether from a third party or not, is considered as general advice only.  This article should not be construed as containing investment advice, investment recommendations, an offer of or solicitation for any transactions in financial instruments.

    goTop
    quote
    Related Articles
    placeholder
    Bitcoin Hits $90K as Crypto Market Surge Wipes Out $120M in Short PositionsBitcoin ascended to $90,000 before a swift correction, impacting both long and short positions.Liquidity maneuvers continue to dominate BTC's short-term price dynamics, with recent sessions squeezing short sellers.
    Author  Mitrade
    Dec 18, Thu
    Bitcoin ascended to $90,000 before a swift correction, impacting both long and short positions.Liquidity maneuvers continue to dominate BTC's short-term price dynamics, with recent sessions squeezing short sellers.
    placeholder
    Bitcoin-to-Gold Ratio Plummets 50% as Gold Breaks $4,000 in 2025In 2025, gold outpaced Bitcoin, slashing the BTC-to-gold ratio by half from 40 to 20 ounces per BTC.
    Author  Mitrade
    Dec 17, Wed
    In 2025, gold outpaced Bitcoin, slashing the BTC-to-gold ratio by half from 40 to 20 ounces per BTC.
    placeholder
    Senate Delays Crypto Market Structure Hearings to Early 2026The Senate Banking Committee has postponed cryptocurrency market structure hearings until 2026, citing ongoing bipartisan negotiations.
    Author  Mitrade
    Dec 16, Tue
    The Senate Banking Committee has postponed cryptocurrency market structure hearings until 2026, citing ongoing bipartisan negotiations.
    placeholder
    Bitcoin Slides 5% as Sellers Lean In — Can BTC Reclaim $88,000?Bitcoin has dropped back below $88,000 after rolling over from $90,500, with price still trading under the 100-hour Simple Moving Average. The sell-off found a floor at $85,151, and BTC is now consolidating near that base, but rebounds are facing pressure from a bearish trend line around $89,000. Bulls need to retake $88,000–$89,000 to ease downside risk; failure to do so keeps $85,500–$85,000 and then $83,500 in play, with $80,000 as the deeper “line in the sand.” Bitcoin (BTC) is back in damage-control mode after a sharp pullback wiped out recent gains. The price failed to reclaim the $90,000–$90,500 band, rolled over, and slid through $88,500 before briefly dipping under $87,000. Buyers did show up around $85,000, but the rebound so far looks more like stabilization than a clear trend reversal. Bitcoin dips hard, finds a bid near $85,000(h3) BTC’s latest move lower began when it couldn’t build follow-through above $90,000 and $90,500. Once that upside stalled, sellers took control and pushed price down through $88,500. The slide accelerated enough to spike below $87,000, but the market didn’t free-fall. Bulls defended the $85,000 zone, printing a low at $85,151. Since then, Bitcoin has been consolidating below the 23.6% Fibonacci retracement of the drop from the $93,560 swing high to the $85,151 low — a clue that the bounce is still shallow and that sellers haven’t fully backed off yet. Structurally, BTC is still on the back foot: It’s trading below $88,000, and It remains below the 100-hour Simple Moving Average, keeping short-term trend pressure pointed downward. Resistance is layered, and $89,000 is the problem area(h3) If bulls try to turn this into a recovery, they’ll have to climb through multiple ceilings in quick succession. First, BTC faces resistance around $87,150, followed by a more meaningful barrier near $87,500. From there, the market’s attention snaps back to $88,000 — the level BTC just lost and now needs to reclaim. A close back above $88,000 would improve the tone, but it doesn’t solve the bigger issue: there’s a bearish trend line on the hourly BTC/USD chart (Kraken feed) with resistance near $89,000, which also lines up with the next technical hurdle. If BTC can push through $89,000 and hold, the rebound could extend toward $90,000, with follow-through targets at $91,000 and $91,500. But until price clears that $88,000–$89,000 zone, rallies are at risk of being sold rather than chased. If BTC fails to reclaim resistance, the downside path is clear(h3) The near-term bear case is simple: if Bitcoin can’t climb back above the $87,000 area and keep traction, sellers may attempt another leg lower. Support levels line up like this: Immediate support: $85,500 First major support: $85,000 Next support: $83,500 Then $82,500 in the near term Below that, the major “don’t break this” level is still $80,000. If BTC slips under $80,000, the risk of acceleration to the downside increases significantly — not because it’s magic, but because it’s the kind of psychological and structural level that tends to trigger forced de-risking. Indicators: momentum still leans bearish(h3) The intraday indicators aren’t offering much comfort yet: Hourly MACD is losing pace in the bearish zone. Hourly RSI remains below 50, suggesting sellers still have the upper hand on short timeframes. So while the $85,000 defense held for now, the market hasn’t flipped bullish — it’s just stopped bleeding.
    Author  Mitrade
    Dec 16, Tue
    Bitcoin has dropped back below $88,000 after rolling over from $90,500, with price still trading under the 100-hour Simple Moving Average. The sell-off found a floor at $85,151, and BTC is now consolidating near that base, but rebounds are facing pressure from a bearish trend line around $89,000. Bulls need to retake $88,000–$89,000 to ease downside risk; failure to do so keeps $85,500–$85,000 and then $83,500 in play, with $80,000 as the deeper “line in the sand.” Bitcoin (BTC) is back in damage-control mode after a sharp pullback wiped out recent gains. The price failed to reclaim the $90,000–$90,500 band, rolled over, and slid through $88,500 before briefly dipping under $87,000. Buyers did show up around $85,000, but the rebound so far looks more like stabilization than a clear trend reversal. Bitcoin dips hard, finds a bid near $85,000(h3) BTC’s latest move lower began when it couldn’t build follow-through above $90,000 and $90,500. Once that upside stalled, sellers took control and pushed price down through $88,500. The slide accelerated enough to spike below $87,000, but the market didn’t free-fall. Bulls defended the $85,000 zone, printing a low at $85,151. Since then, Bitcoin has been consolidating below the 23.6% Fibonacci retracement of the drop from the $93,560 swing high to the $85,151 low — a clue that the bounce is still shallow and that sellers haven’t fully backed off yet. Structurally, BTC is still on the back foot: It’s trading below $88,000, and It remains below the 100-hour Simple Moving Average, keeping short-term trend pressure pointed downward. Resistance is layered, and $89,000 is the problem area(h3) If bulls try to turn this into a recovery, they’ll have to climb through multiple ceilings in quick succession. First, BTC faces resistance around $87,150, followed by a more meaningful barrier near $87,500. From there, the market’s attention snaps back to $88,000 — the level BTC just lost and now needs to reclaim. A close back above $88,000 would improve the tone, but it doesn’t solve the bigger issue: there’s a bearish trend line on the hourly BTC/USD chart (Kraken feed) with resistance near $89,000, which also lines up with the next technical hurdle. If BTC can push through $89,000 and hold, the rebound could extend toward $90,000, with follow-through targets at $91,000 and $91,500. But until price clears that $88,000–$89,000 zone, rallies are at risk of being sold rather than chased. If BTC fails to reclaim resistance, the downside path is clear(h3) The near-term bear case is simple: if Bitcoin can’t climb back above the $87,000 area and keep traction, sellers may attempt another leg lower. Support levels line up like this: Immediate support: $85,500 First major support: $85,000 Next support: $83,500 Then $82,500 in the near term Below that, the major “don’t break this” level is still $80,000. If BTC slips under $80,000, the risk of acceleration to the downside increases significantly — not because it’s magic, but because it’s the kind of psychological and structural level that tends to trigger forced de-risking. Indicators: momentum still leans bearish(h3) The intraday indicators aren’t offering much comfort yet: Hourly MACD is losing pace in the bearish zone. Hourly RSI remains below 50, suggesting sellers still have the upper hand on short timeframes. So while the $85,000 defense held for now, the market hasn’t flipped bullish — it’s just stopped bleeding.
    placeholder
    Macro Analysts: Hawkish Japan Could Push Bitcoin Below $70KAnalysts predict Bitcoin may face further declines towards the $70,000 mark if the Bank of Japan raises interest rates as expected.
    Author  Mitrade
    Dec 15, Mon
    Analysts predict Bitcoin may face further declines towards the $70,000 mark if the Bank of Japan raises interest rates as expected.

    Bitcoin Related Articles

    • Trading Chart Patterns:Ultimate Guide to Price Action
    • How to Day Trade Crypto? Simplest Day Trading Strategy Ever
    • Places that Provide Cheapest Ways to Buy Bitcoin In 2025
    • 10 Best Crypto With Most Potential to Buy and invest in 2025 - Top Picks from Expert Traders
    • Top 10 Bitcoin Mining Apps for Android & iOS During 2024
    • How To Buy Bitcoin In Malaysia? Top 7 Best Crypto Exchanges & Trading Apps

    Click to view more