

Why crypto may see a recovery right before or shortly after Bitcoin halving

- Gold Price Trend Forecast: Why Did Gold Prices Fall After US CPI Cooled? Fed Chair Speech and Iran Situation Become Obstacles
- Gold Price Trend Forecast: June CPI Plus Fed Chair Congressional Testimony, Can Gold Price Hold Above $4,000?
- TradingKey Daily Market Brief: Gold Falls Below $4,000, TSMC’s Strong Earnings Fail to Stop AI Trade Cooling, Chip Stocks Sold Off
- Gold Price Forecast: Cooling Inflation Fails to Offset Fed Hawkish Pressure, Gold Price May Fall to $3,500
- Tesla Q2 Earnings Preview: Record Deliveries Fail to Hide Profit Pressure, Can Musk Rely on AI and Autonomous Driving to Unlock New Growth Space?
- Today’s Market Recap: Unexpected PPI Drop Boosts Markets, Apple Hits All-Time High, AI Hardware Stocks Remain Under Pressure, Micron, SanDisk Slump
■ Bitcoin price is down 17% since the $73,777 all-time high recorded on March 14.
■ Subsiding FOMO coupled with growing FUD suggests a recovery in price amid more rational trading behavior and price stability.
■ Santiment analysts report soaring bear market mentions with markets known to go the other way relative to trader expectations.
Cryptocurrency market is bleeding, with Bitcoin (BTC) price leading altcoins south in a broader market crash. The elevated risk levels have bulls sitting on their hands, but analysts from Santiment say this bleed may only be cauterized right before or shortly after the halving.
Bitcoin price crash catalysts
Bitcoin price has been dumping since April 9. However, the slump seems to have intensified over the past few days, catalyzed by three key reasons.
● The confrontation between Iran and Israel
● In the latest development, the former Mossad intelligence chief has said that they could strike Iran's nuclear facilities. This assertion could worsen the situation not only in the conflict but also in the market as it inspired panic. Investors could intensify their flight to safety in favor of more traditional assets like gold and silver.
● Fed Chair Jerome Powell’s recent hawkish stand
In a Tuesday announcement, Federal Reserve chair Jerome Powell indicated that the agency is still not very confident about inflation. Specifically, Powell said they could keep the interest rates higher for longer. The reversal was surprising, given the market was anticipating a rate cut in June, but now there is doubt about whether any rate cut is in sight.
● Greed among retail traders
● Retail greed has also played a role in the downtrend, seen with the way this class of traders continues to long every dip with high leverage. Even in the face of recent corrections, the funding rate remained positive, evidence of market greed.
Trader and analyst @Ashcryptoreal on X says:
Unless and until we see a full reset or even negative funding for some time, the market could keep going sideways/down.
Why a recovery could be looming
According to Santiment’s research, the bull market is likely in the conclusion phase after a 17% fall from the $73,777 all-time high. This assumption is based on the findings that bear market mentions are increasing.
If history is enough to go by, prices tend to go the opposite way relative to market expectations, and with the fear of missing out (FOMO) dwindling against a rise in fear, uncertainty, and doubt (FUD), the unique mix of these metrics could lead to a recovery either right before the halving or shortly after.
According to the #crypto crowd, the #bullmarket has essentially come to an end after #Bitcoin's -16% market value drop since the #AllTimeHigh of $73.6K hit back on March 14th. At the same time, #bearmarket mentions are increasing. Historically, prices move the opposite…
— Santiment (@santimentfeed) April 17, 2024
The described correlation between FOMO and FUD results in hype and speculative buying interest fading, which is a recipe for a more rational trading behavior and price stability. If these trends continue, it may indicate an upcoming positive shift in sentiment.
Either way, risk management is key in navigating market volatility influenced by these psychological factors.
Open Interest, funding rate FAQs
Higher Open Interest is associated with higher liquidity and new capital inflow to the market. This is considered the equivalent of increase in efficiency and the ongoing trend continues. When Open Interest decreases, it is considered a sign of liquidation in the market, investors are leaving and the overall demand for an asset is on a decline, fueling a bearish sentiment among investors.
Funding fees bridge the difference between spot prices and prices of futures contracts of an asset by increasing liquidation risks faced by traders. A consistently high and positive funding rate implies there is a bullish sentiment among market participants and there is an expectation of a price hike. A consistently negative funding rate for an asset implies a bearish sentiment, indicating that traders expect the cryptocurrency’s price to fall and a bearish trend reversal is likely to occur.
At the time of writing, Bitcoin price is trading for $61,277, defending against further downside as it tests the demand zone between $60,364 and $62,412. A candlestick close below the midline of this order block at $61,421 would confirm a further downtrend.
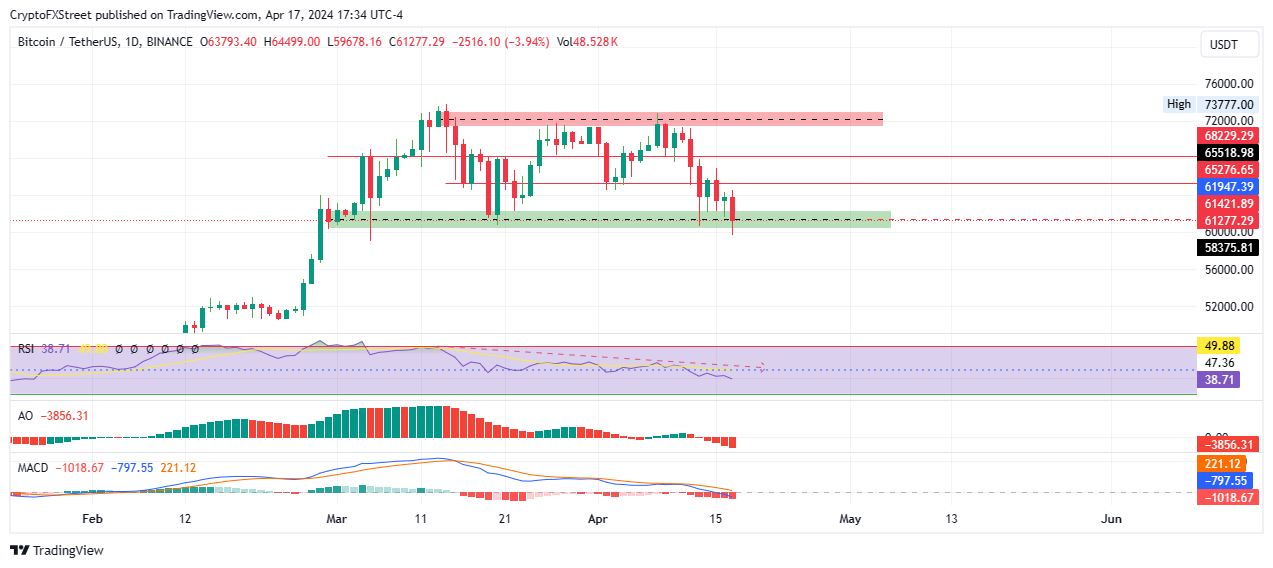
BTC/USDT 1-day chart
Read more
* The content presented above, whether from a third party or not, is considered as general advice only. This article should not be construed as containing investment advice, investment recommendations, an offer of or solicitation for any transactions in financial instruments.


