
Bitcoin Price Forecast: Tariff volatility sweeps over $200 billion from crypto markets

- Gold tumbles as traders book profits ahead of key US inflation data
- Australian Dollar remains stronger following PBoC interest rate decision
- Gold tumbles as traders book profits ahead of key US inflation data
- Forex Today: US Dollar extends slide, Gold surges past $4,300
- Meme Coins Price Prediction: Dogecoin, Shiba Inu, Pepe flash bearish potential
- Japanese Yen strengthens on safe-haven flows, USD/JPY tests 150.00 amid weaker USD

Bitcoin price hovers around $83,000 on Thursday after it failed to close above the $85,000 resistance level the previous day.
Volatility fueled by Trump’s tariffs swept $200 billion from total market capitalization, liquidating over $178 million in BTC.
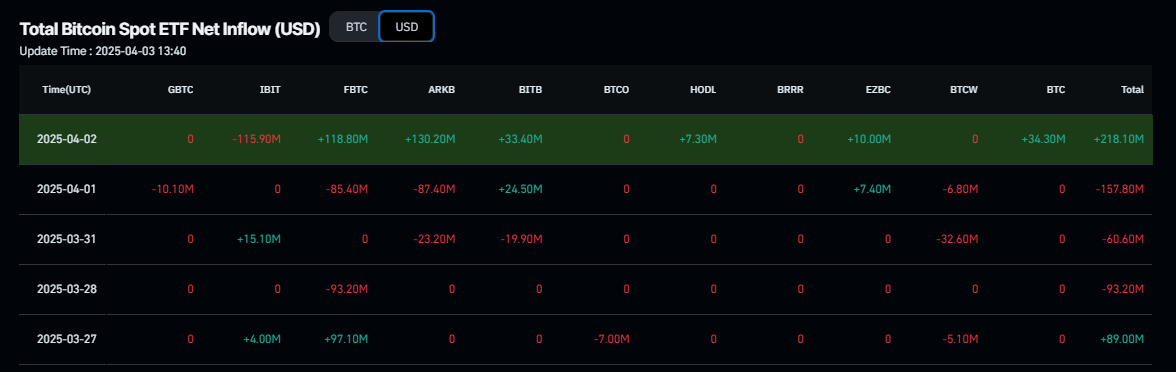
Institutional investors bought the dips despite this price volatility as the US spot Bitcoin ETF recorded $218 million in inflows.
Bitcoin (BTC) price hovers around $83,000 at the time of writing on Thursday after it failed to close above a critical resistance level the previous day. Volatility in the crypto market is fueled by US President Donald Trump’s tariff announcement on Wednesday, which swept $200 billion from total market capitalization and liquidated over $178 million in BTC. Despite this price volatility, institutional investors bought the dips as the US spot Bitcoin Exchange Traded Funds (ETFs) recorded $218 million in inflows.
Tariff announcement brings volatility in BTC
President Trump announced tariffs on 185 countries at once on Wednesday's so-called’ Liberation Day’, the most harsh tariff in over a century.
The news began with the Wall Street Journal report that the US would impose a 10% baseline tariff. While this was true, markets took it as ‘ALL’ reciprocal tariffs were 10%. Due to this, the US equity market saw a sharp rise, followed by the crypto market, with BTC reaching a high of $88,500. However, both equities and the crypto market took a U-turn at 4:26 PM ET when President Trump picked up the tariff poster on stage at his announcement.
“Before he picked up this poster, futures were up +2%. By 4:42 PM ET, futures had fallen -4% from their high as Trump listed new tariffs name by name,” says The Kobessi Letter report.

S&P 500 E-mini futures chart. Source: The Kobeissi Letter
The tariffs were calculated at half of the rate at which countries are currently charging the US. As for reference, China, which the US claims, currently charges 67% tariffs. This means a 34% tariff is coming for China and 20% for the European Union, which is clearly much more than the 10%.
This news triggered volatility in the crypto market as BTC declined from its high of $88,500 to its low of $82,320 on Wednesday, wiping $200 billion from the total crypto market cap and $178.72 million in liquidation on BTC, as shown in the graph below.
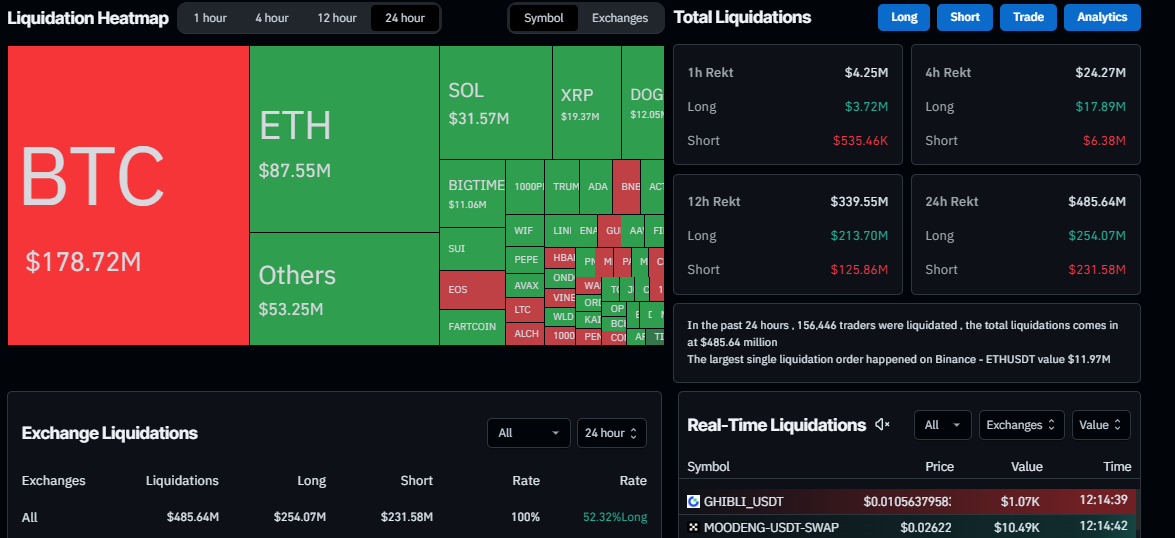
Liquidation chart. Source: Coinglass
Institutional investors bought Bitcoin dips
According to Coinglass, Bitcoin spot ETF data recorded an inflow of $218.10 million on Wednesday, breaking its long streak of outflows since Friday. This inflow shows that institutional investors bought the recent price dip. If this inflow continues and intensifies, Bitcoin’s price could see a recovery ahead.
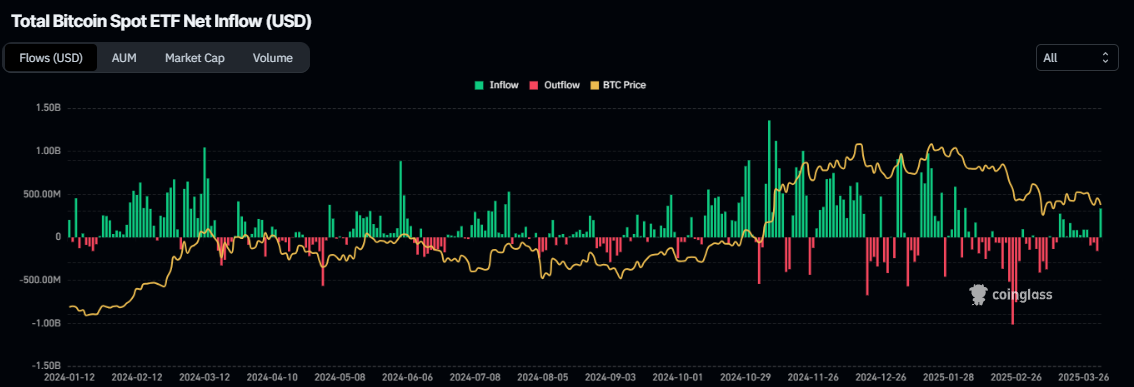
Total Bitcoin Spot ETF net inflow chart. Source: Coinglass
Bitcoin Price Forecast: BTC shows weakness as it fails to close above $85,000
Bitcoin was rejected by the 50% Fibonacci retracement (drawn from its November low of $66,835 to its all-time high of $109,588 in January) at $88,211 and declined 3.10% on Wednesday. Moreover, BTC failed to close above its daily resistance level of $85,000. This daily level roughly coincides with the 200-day Exponential Moving Average (EMA) and a descending trendline, making it a key resistance zone. At the time of writing on Thursday, BTC recovers slightly, hovering around $83,000.
The Relative Strength Index (RSI) indicator on the daily chart reads 46 after being rejected from its neutral level of 50 on Tuesday, indicating slight bearish momentum. If the RSI continues to slide downwards, the bearish momentum will increase, leading to a sharp fall in the BTC price.
The Moving Average Convergence Divergence (MACD) lines coil against each other, indicating indecisiveness among traders.
If BTC continues to find rejection from the daily resistance at $85,000, it could extend the decline to retest its next support level at $78,258.
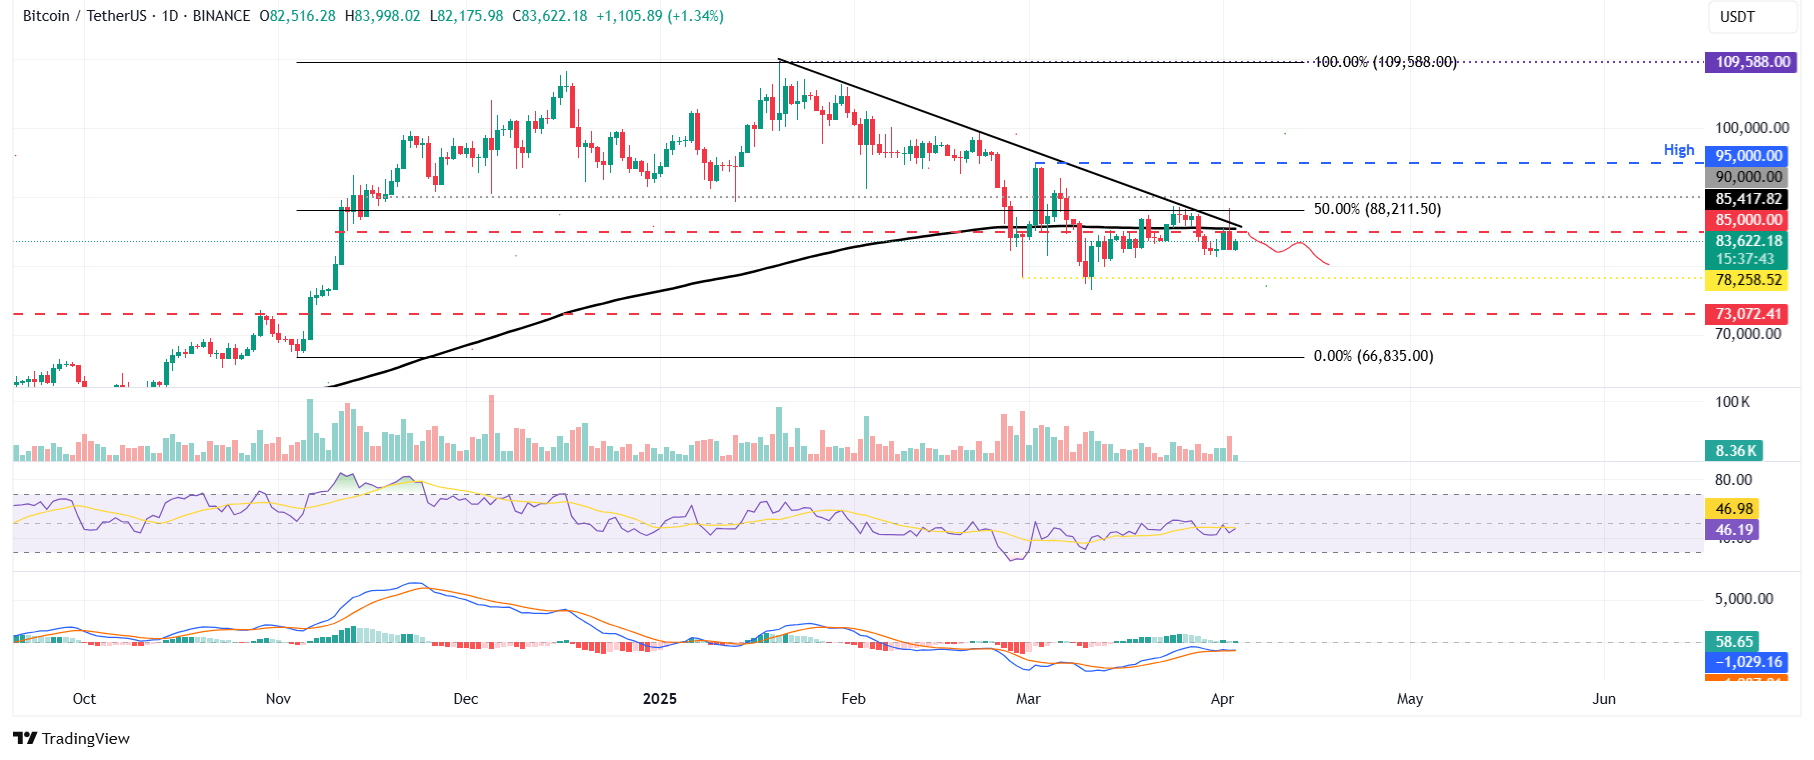
BTC/USDT daily chart
However, if BTC recovers and closes above its daily resistance at $85,000, it could extend the recovery rally to the key psychological level of $90,000.
Read more
* The content presented above, whether from a third party or not, is considered as general advice only. This article should not be construed as containing investment advice, investment recommendations, an offer of or solicitation for any transactions in financial instruments.


