We’re in the early stages of a crypto winter. Here are the signs

Mitrade
coverImg
Source: DepositPhotos

Coinbase has said what everyone’s been scared to admit: the next crypto winter has probably already started, and the signs are everywhere, according to a report released by the company on Tuesday.


The total crypto market cap without Bitcoin has dropped to $950 billion—that’s a nasty 41% drop from its December 2024 high of $1.6 trillion. It’s also 17% lower than where things stood a year ago. To be clear, this is below nearly the entire range of prices seen between August 2021 and April 2022.


At the same time, there’s been a little uptick in venture capital activity during Q1 2025, but it’s still way down—50% to 60% lower than the insane highs of 2021–2022.

We're in the early stages of a crypto winter. Here are the signs.


Investors cut exposure as macro pressure builds


Coinbase analysts say this bad run could last at least another 4 to 6 weeks, if not longer. According to their outlook, “the interplay of macro factors and risk sentiment still calls for short-term caution.”


But they’re also trying to play the long game. Coinbase said, “Once the mood resets, it might do so fast.” They’re still betting on a stronger second half of 2025, though right now, most traders are sitting on their hands.


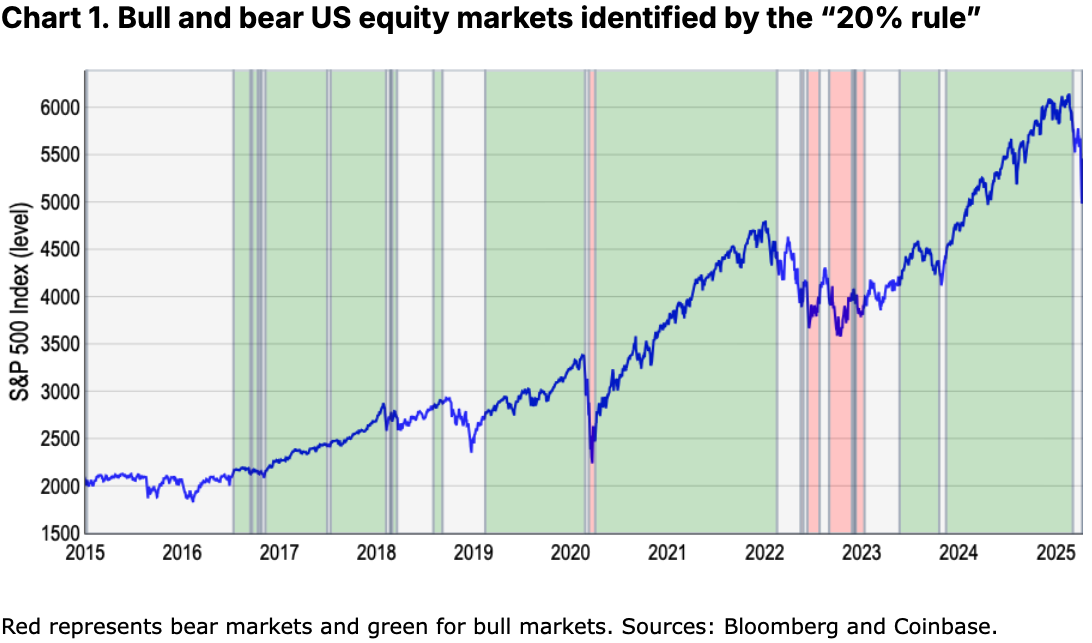
Forget the idea that a 20% swing marks a bull or bear market. That rule barely works in stocks and makes even less sense in crypto, where 20% moves happen in a weekend.


Case in point: when Bitcoin dropped 76% between November 2021 and November 2022 while the S&P 500 only fell 22% during the same window. That’s more than 3x the pain, yet both happened during the same overall macro hellscape, said Coinbase.

We're in the early stages of a crypto winter. Here are the signs.


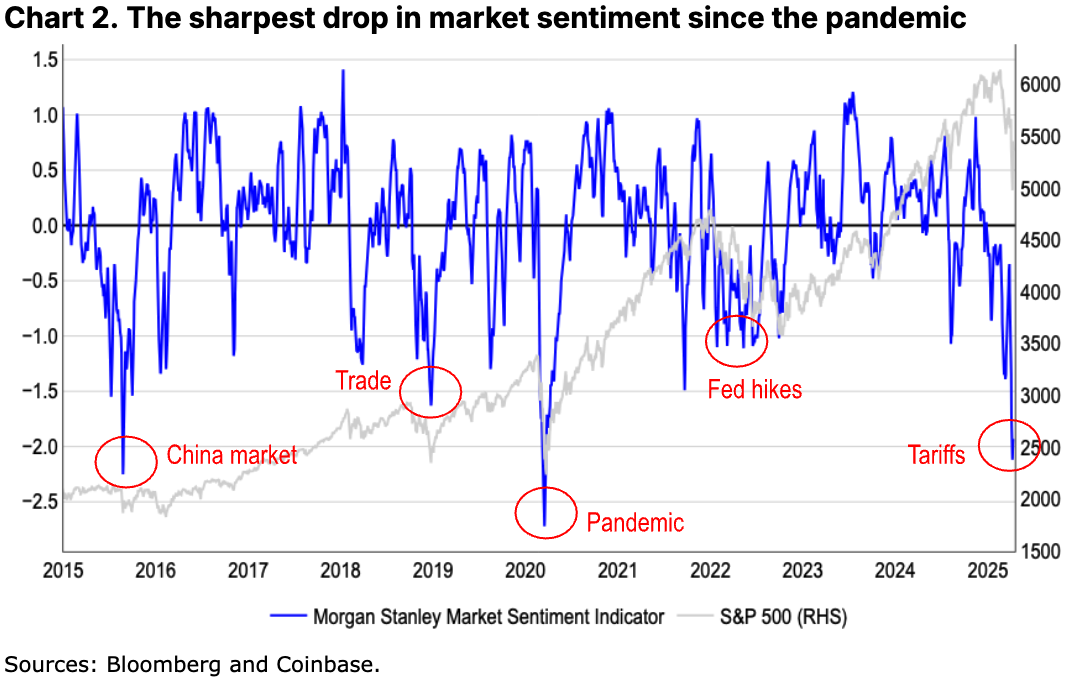
Because crypto never sleeps, it reacts faster and harder to global shocks. Weekends and nights—when stock markets are closed—are when a lot of the drama happens. That makes crypto a punching bag for all global sentiment changes. One trigger and everything spirals.


There’s no agreed-on definition of what actually makes a bear market. People throw out that 20% number, but it’s just tradition—not science.


As Coinbase put it, it’s more like “you know it when you see it.” They studied the S&P 500 by looking at its one-year rolling highs and lows to find real changes. That method showed four bull markets and two bear markets in the last 10 years—not counting the new dip that began around late March and early April.


But even that method missed two big panic moments: 2015, when China’s markets crashed, and 2018, when the Fed’s global trade uncertainty index spiked. Both caused deep investor fear but didn’t hit the 20% number. So clearly, it’s not about the percentage.


Alternative indicators show the market damage is deeper


To fix that, Coinbase says they’re using new tools risk-adjusted performance—basically how far returns move from the average, measured in standard deviations.


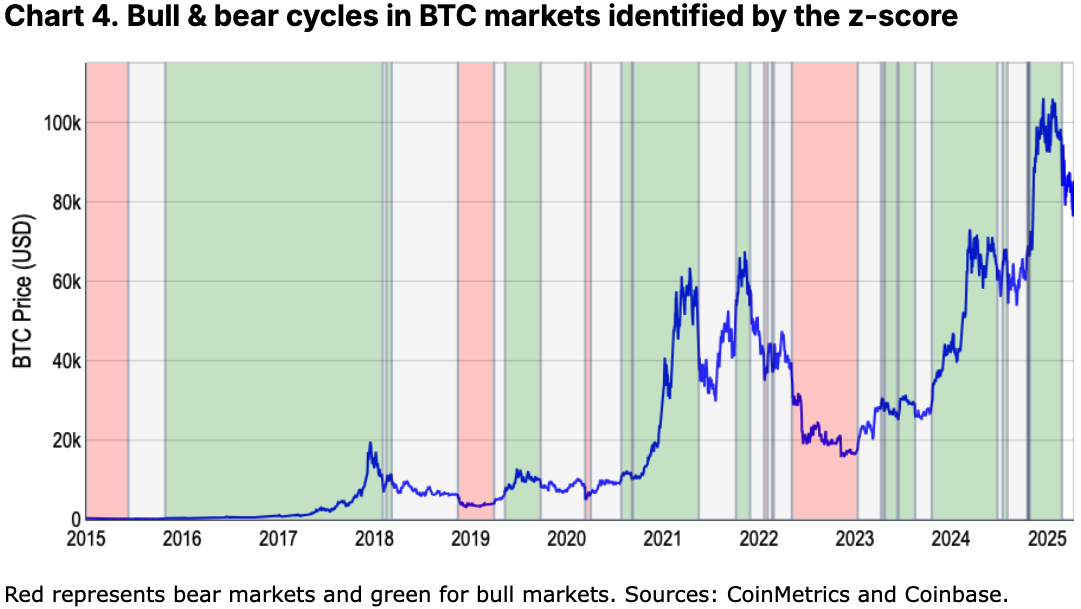
From November 2021 to November 2022, Bitcoin dropped 1.4 standard deviations, which is dangerously close to the S&P 500’s 1.3 standard deviation decline. That shows how big the crash was, even if the raw numbers look different.

We're in the early stages of a crypto winter. Here are the signs.


Measuring by risk lets you compare across assets, but the downside is it’s very complicated. The z-score model gives fewer signals when markets are calm and doesn’t always catch fast changes.


Their data says the most recent bull cycle ended in late February. Since then, the model has shown nothing but neutral, which means it’s late to react.


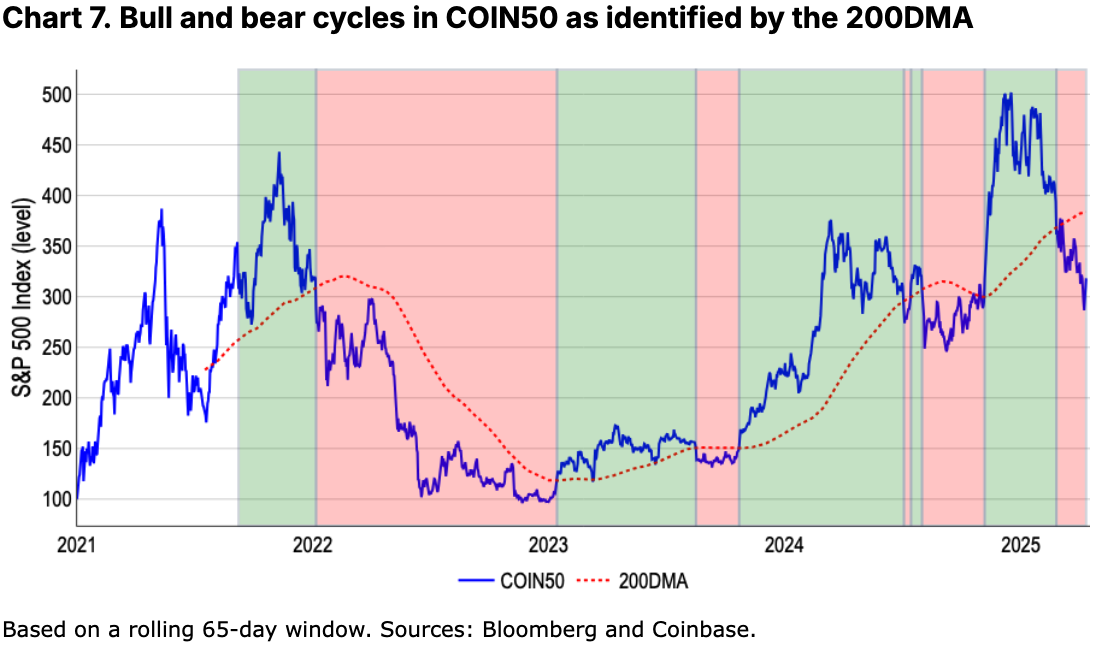
The 200-day moving average (200DMA) might be better. It’s easier to use and smooths out short-term noise. When prices fall below their 200-day average, that’s usually a real trend change.


It caught the big sell-offs in early 2020 (COVID), 2022-23 (Fed hiking), the 2018–19 crypto winter, and the mid-2021 crash caused by China’s mining ban.

We're in the early stages of a crypto winter. Here are the signs.


So, is this a new crypto winter? Coinbase’s Tuesday report said yes, and it’s just getting started. “The 200DMA model on bitcoin does suggest that the token’s recent steep decline qualifies this as a bear market cycle starting in late March. But the same exercise performed on the COIN50 index (which includes the top 50 tokens by market capitalization) shows the asset class as a whole has been unequivocally trading in bear market territory since the end of February,” said Coinbase.

Read more

  • Gold Price Forecast: Gold Tumbles Below $3,900 as Trump Says No Need for Iran Deal; Can October PPI Spur a Rebound?
  • * The content presented above, whether from a third party or not, is considered as general advice only.  This article should not be construed as containing investment advice, investment recommendations, an offer of or solicitation for any transactions in financial instruments.

    goTop
    quote
    Related Articles
    placeholder
    Ethereum Drops Below $2,000 After Plunging Over 20% in a Month as Odds of $1,500 Retest SurgeEthereum Plunges Over 20% in a Month, Risking a Retest of $1,500 After Losing the $2,000 Defense Line.On November 13, Ethereum (ETH) plunged more than 5%, officially falling below the key
    Author  TradingKey
    Nov 13, Fri
    Ethereum Plunges Over 20% in a Month, Risking a Retest of $1,500 After Losing the $2,000 Defense Line.On November 13, Ethereum (ETH) plunged more than 5%, officially falling below the key
    placeholder
    Bitcoin lost its 200-day average — but the exit started three sessions before the CPIBitcoin fell 2.5% to about $73,400 on 11 November, an 11-week low, breaking its 200-day moving average near $73,100. The 24-hour liquidation tally reached $632 to $705 million, roughly 82% of it longs. But spot ETF outflows began three sessions earlier and USDT's market cap has shrunk $6.6 billion in 60 days — the leveraged length left before the inflation print did. A double top at 81,890 and 81,080 leaves a measured target of 69,366.
    Author  Suzie
    Nov 11, Wed
    Bitcoin fell 2.5% to about $73,400 on 11 November, an 11-week low, breaking its 200-day moving average near $73,100. The 24-hour liquidation tally reached $632 to $705 million, roughly 82% of it longs. But spot ETF outflows began three sessions earlier and USDT's market cap has shrunk $6.6 billion in 60 days — the leveraged length left before the inflation print did. A double top at 81,890 and 81,080 leaves a measured target of 69,366.
    placeholder
    Bitcoin Price Forecast: BTC faces pressure as weekly ETF outflows hit $1.28 billionBitcoin (BTC) remains under pressure on Monday, trading below the 50-week Simple Moving Average (SMA) at $75,222 after extending its losing streak to five consecutive weeks.
    Author  FXStreet
    Nov 09, Mon
    Bitcoin (BTC) remains under pressure on Monday, trading below the 50-week Simple Moving Average (SMA) at $75,222 after extending its losing streak to five consecutive weeks.
    placeholder
    Bitcoin ETFs sold $1.28 billion in a week — and BTC is still above 75,000US spot Bitcoin ETFs logged $1.28 billion of net outflows in the week to Nov 6, the largest since late June, with BlackRock's IBIT accounting for $1.21 billion. Yet BTC only fell from $80,405 to $74,940, a 6.8% move. The gap between the fund flow and the price is the story: leveraged longs were flushed, but spot holders did not follow the ETFs out — and $75,000 is the line that decides whether that reading holds.
    Author  Suzie
    Nov 09, Mon
    US spot Bitcoin ETFs logged $1.28 billion of net outflows in the week to Nov 6, the largest since late June, with BlackRock's IBIT accounting for $1.21 billion. Yet BTC only fell from $80,405 to $74,940, a 6.8% move. The gap between the fund flow and the price is the story: leveraged longs were flushed, but spot holders did not follow the ETFs out — and $75,000 is the line that decides whether that reading holds.
    placeholder
    Binance replaced 95% of a $6.3bn hole — Bitcoin is trading the plumbing, not the coinBinance resumed withdrawals on November 1 after a record $6.3bn theft. In the first 9.5 hours, users withdrew $4.64bn and deposited $1.01bn, a net outflow of $3.64bn, or 2.1% of assets. Bitcoin fell to 76,173 and is now 78,473. The market is pricing the exchange, not the supply.
    Author  Suzie
    Nov 02, Mon
    Binance resumed withdrawals on November 1 after a record $6.3bn theft. In the first 9.5 hours, users withdrew $4.64bn and deposited $1.01bn, a net outflow of $3.64bn, or 2.1% of assets. Bitcoin fell to 76,173 and is now 78,473. The market is pricing the exchange, not the supply.
    Live Quotes
    Name / SymbolChart% Change / Price
    BTCUSD
    BTCUSD
    0.00%0.00
    ETHUSD
    ETHUSD
    0.00%0.00
    XRPUSD
    XRPUSD
    0.00%0.00
    TRUMPUSD
    TRUMPUSD
    0.00%0.00
    DOGEUSD
    DOGEUSD
    0.00%0.00

    cryptocurrency Related Articles

    • Top 3 Price Prediction: Bitcoin, Ethereum, Ripple — Bulls take the reins, with $100K BTC, $3,500 ETH and $2.35 XRP in focus
    • Best Strategies When BTC Price Drops: From Hedging to Accumulating
    • How to Day Trade Crypto? Simplest Day Trading Strategy Ever
    • Trading Chart Patterns:Ultimate Guide to Price Action
    • Places that Provide Cheapest Ways to Buy Bitcoin In 2025
    • 10 Best Crypto With Most Potential to Buy and invest in 2025 - Top Picks from Expert Traders

    Click to view more