
Top 3 Price Prediction Bitcoin, Ethereum, Ripple: Possible moves as BTC goes back to consolidation mode

Bitcoin price back to consolidation
Bitcoin (BTC) price has fallen back to its longstanding range bound movement, coiling up around the $25,824 level. Two outcomes are likely after such a move, a break north or south. Currently, the odds favor the downside and BTC could draw nearer to the $24,995 support level and extend the losses to the psychological $24,000.
In the dire case, Bitcoin price could dip into the demand zone between $21,711 and $20,155. This outlook draws inspiration from the Relative Strength Index (RSI), currently declining to show falling momentum. Similarly, the histogram bars of the Awesome Oscillator flash red to suggest a presence of bears in the market.

BTC/USDT 1-day chart, Source: TradingView.
Conversely, a renaissance by the bulls could alter the impending fate for Bitcoin price, with a possible foray back above the psychological $28,000, level last tested on August 29. Increased buyer momentum could send the flagship crypto past the $29,692 barricade, or in a highly bullish case, shatter the $31,518 obstacle.
Ethereum price tests $1,630 support level
Ethereum (ETH) price is barely holding above the $1,630 support level, even as BTC shows weakness. Increased seller momentum could send the price lower, potentially breaching the $1,522 support level. A decisive flip of this buyer congestion level into resistance would solidify the downtrend for the short term and mark a 5% landslide.
Like BTC, the momentum indicators point to a similar outcome as momentum is steadily declining and the RSI could soon activate a signal to sell ETH when it crosses below the signal line (yellow band). Traders heeding this call would bode poorly for ETH.
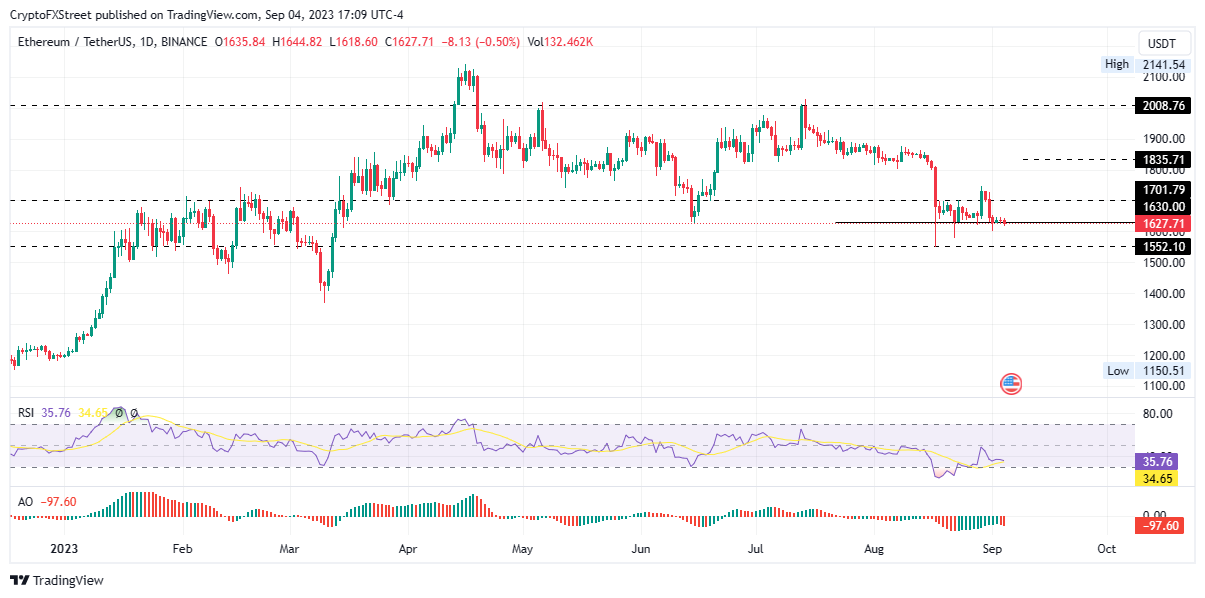
ETH/USDT 1-day chart, Source: TradingView.
On the other hand, late or sidelined investors could salvage Ethereum price from the impending slump, with a possible move above the $1,701 resistance level. Increased buying pressure from this level could see ETH ascend to confront the mid-August highs around $1,835, or in the highly ambitious cases, attempt to break from current gloom by making a strong reach above $2,008.
Ripple price goes AWOL
Ripple (XRP) price is nurturing a uptrend that could materialize if early profit takers keep their profit appetite in check. The token boasts three successive green candlesticks, pointing to bulls gaining ground.
Increased buying pressure could sustain the uptrend, sending Ripple price above the immediate hurdle at $0.5667, which stands as multi-month resistance level barring two equal highs and therefore significant.
Higher, Ripple price would have a shot at reclaiming the ground lost after the July 13 ascent, first breaching the $0.6840 level before taking back control with a solid move above the $0.8193 resistance level.
Noteworthy the RSI had executed a bullish crossover, moving above the signal line in an attempt to siren a buy signal. Traders harkening to this call could enhance the uptrend for Ripple price. The AO makes the bullish outlook stronger, with the histogram bars soaking in green and edging toward the midline. This adds credence to the bullish outlook.
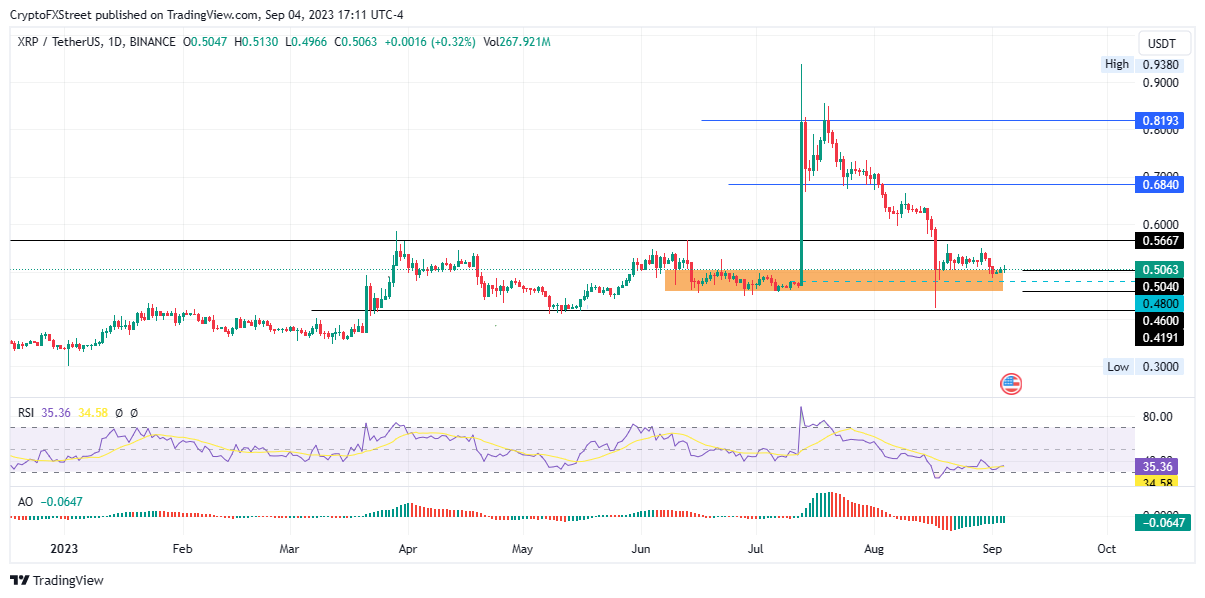
XRP/USDT 1-day chart, Source: TradingView.
On the other side, early profit takers from XRP holders who are incurring losses at current price or breaking even and looking for early exits to escape losses could sell the remittance token, so much so that the demand zone between $0.5040 and $0.4600 fails to hold as support.
A decisive break below the mean threshold (midline of demand zone marked in blue) would invalidate the bullish thesis, exposing XRP to an extrapolated slump toward the $0.4191 support level.
* The content presented above, whether from a third party or not, is considered as general advice only. This article should not be construed as containing investment advice, investment recommendations, an offer of or solicitation for any transactions in financial instruments.


