Bitcoin Price Prediction: Short-term holders dominate BTC flows as valuation surges

Mitrade
Trending Articles
coverImg
Source: DepositPhotos


Bitcoin price is on a tear this week, extending the gains made since spot ETFs started trading in January.


●BTC could nick $60,000 as Glassnode reports relatively strong demand for speculation and trading activity.


●If the king of crypto loses the $50,000 milestone, it could trigger a sell-off, likely going as low as $40,000.


Bitcoin (BTC) price broke out on Monday with upwards of 5% in gains, shattering the $57,000 level amid hype instigated by news relating to BlackRock and MicroStrategy. In a recent report, Glassnode has revealed key insights that could have a strong bearing on the market.


Bitcoin investors increase risk appetite


In a February 27 newsletter, on-chain market intelligence firm Glassnode indicated that the risk appetite among Bitcoin investors has increased, citing “growing signs of speculation appearing across capital flows, exchange activity, derivatives leverage, and even institutional demand.”


The highlight of the Glassnode report was on capital inflows with the report citing a “steady and healthy inflow of capital into the [BTC] asset.” The report notes that the recovery rally for Bitcoin price is near completion with capital progressively pouring into the BTC market. With this influx, the realized market capitalization of BTC is nearing$460 billion, 3% below its all-time high.


This remarkable performance has seen the profitability of BTC investors improve significantly, with the average investor now holding an unrealized profit of over 120% per coin.


Further, exchange inflow volumes now record levels not seen before, with short-term holders dominating the flows depositing over $2 billion of volume to exchanges per day. According to Glassnode, this points to “a relatively strong demand for speculation and trading activity.”


Another metric that is also recording near all-time highs is the open interest in both futures and options markets. With the sum of all open long and short positions at their peak, directional short-sellers are actively betting against the uptrend.


While Glassnode notes at least $465 million in liquidation volume over the last month, a Monday report by the FXStreet team cited almost $100 million in shorts liquidated as BTC approached the $55,000 milestone and over $250 million in total liquidations once BTC nicked the $57,000 milestone.


Bitcoin price outlook as Glassnode notes heightened capital inflows in BTC market


Bitcoin price continues to hold above $57,000 with prospects for more gains expected with the Relative Strength Index (RSI) inclined north. This suggests rising momentum accentuated by the Awesome Oscillator (AO) and Moving Average Convergence Divergence (MACD), which both remain in positive territory.


Increased buying pressure could see Bitcoin price tag the $60,000 psychological level, 5% above current levels. In a highly bullish case, the leading cryptocurrency by market capitalization could have a chance at retaking its peak price of $69,000. For this to happen, Bitcoin price must foray into the supply zone between $63,329 and $67,999 and break and close above its midline at $65,664 on the daily time frame. Such a move would confirm the continuation of the uptrend.


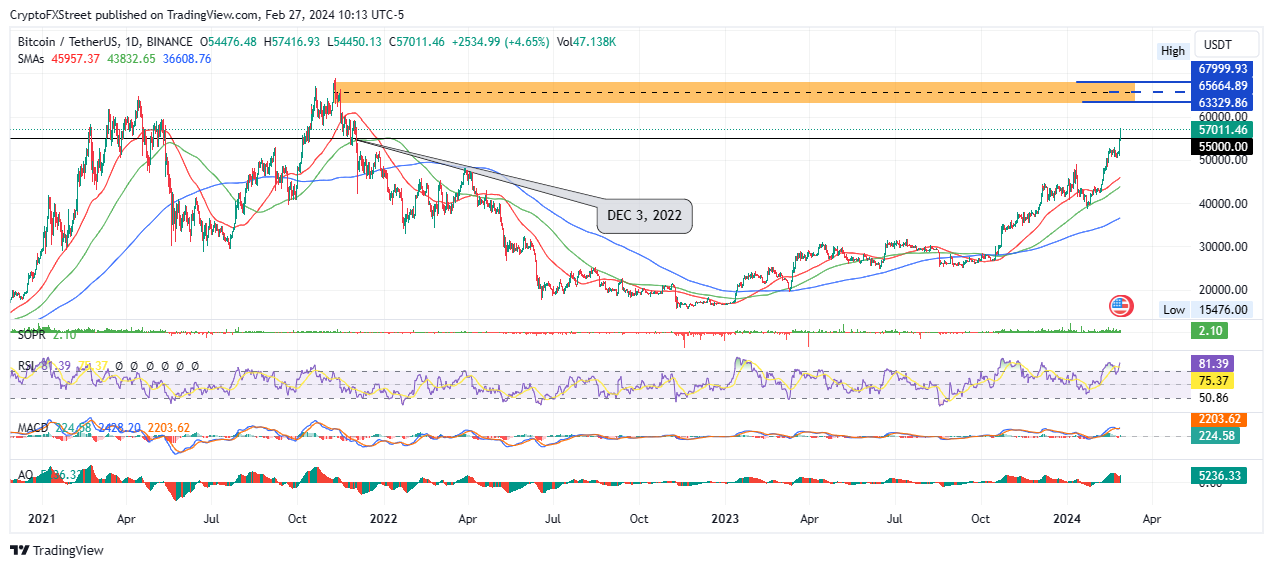
BTC/USDT 1-day chart, Source: TradingView.


Conversely, early profit taking could see Bitcoin price drop below the $55,000 threshold. If sellers have their way, the decline could see BTC test $50,000.


Notice the Spent Output Profit Ratio (SOPR) position at 2.10 shows that a pullback could be due. As a 30-day moving average (MA), anytime this ratio is above 1 it shows that token holders who are sitting on unrealized profits are leaning toward cashing in on their gains.


The pullback supposition is accentuated by the RSI gliding above 70, which shows that while BTC is not ripe for selling, it is at high risk of correcting as an aftermath of an overbought asset. 


Read more

  • Pound Sterling slumps as UK inflation falls by more than expected to 3.2%
  • Gold Price Forecast: XAU/USD climbs above $4,250 as Fed rate cut weakens US Dollar
  • AUD/USD remains depressed below mid-0.6600s; downside seems limited ahead of US NFP report
  • Tesla Stock Hits Record High as Robotaxi Tests Ignite Market. Why Is Goldman Sachs Pouring Cold Water on Tesla?
  • * The content presented above, whether from a third party or not, is considered as general advice only.  This article should not be construed as containing investment advice, investment recommendations, an offer of or solicitation for any transactions in financial instruments.

    goTop
    quote
    Related Articles
    placeholder
    Bitcoin Hits $90K as Crypto Market Surge Wipes Out $120M in Short PositionsBitcoin ascended to $90,000 before a swift correction, impacting both long and short positions.Liquidity maneuvers continue to dominate BTC's short-term price dynamics, with recent sessions squeezing short sellers.
    Author  Mitrade
    8 hours ago
    Bitcoin ascended to $90,000 before a swift correction, impacting both long and short positions.Liquidity maneuvers continue to dominate BTC's short-term price dynamics, with recent sessions squeezing short sellers.
    placeholder
    Bitcoin-to-Gold Ratio Plummets 50% as Gold Breaks $4,000 in 2025In 2025, gold outpaced Bitcoin, slashing the BTC-to-gold ratio by half from 40 to 20 ounces per BTC.
    Author  Mitrade
    Yesterday 06: 01
    In 2025, gold outpaced Bitcoin, slashing the BTC-to-gold ratio by half from 40 to 20 ounces per BTC.
    placeholder
    Senate Delays Crypto Market Structure Hearings to Early 2026The Senate Banking Committee has postponed cryptocurrency market structure hearings until 2026, citing ongoing bipartisan negotiations.
    Author  Mitrade
    Dec 16, Tue
    The Senate Banking Committee has postponed cryptocurrency market structure hearings until 2026, citing ongoing bipartisan negotiations.
    placeholder
    Bitcoin Slides 5% as Sellers Lean In — Can BTC Reclaim $88,000?Bitcoin has dropped back below $88,000 after rolling over from $90,500, with price still trading under the 100-hour Simple Moving Average. The sell-off found a floor at $85,151, and BTC is now consolidating near that base, but rebounds are facing pressure from a bearish trend line around $89,000. Bulls need to retake $88,000–$89,000 to ease downside risk; failure to do so keeps $85,500–$85,000 and then $83,500 in play, with $80,000 as the deeper “line in the sand.” Bitcoin (BTC) is back in damage-control mode after a sharp pullback wiped out recent gains. The price failed to reclaim the $90,000–$90,500 band, rolled over, and slid through $88,500 before briefly dipping under $87,000. Buyers did show up around $85,000, but the rebound so far looks more like stabilization than a clear trend reversal. Bitcoin dips hard, finds a bid near $85,000(h3) BTC’s latest move lower began when it couldn’t build follow-through above $90,000 and $90,500. Once that upside stalled, sellers took control and pushed price down through $88,500. The slide accelerated enough to spike below $87,000, but the market didn’t free-fall. Bulls defended the $85,000 zone, printing a low at $85,151. Since then, Bitcoin has been consolidating below the 23.6% Fibonacci retracement of the drop from the $93,560 swing high to the $85,151 low — a clue that the bounce is still shallow and that sellers haven’t fully backed off yet. Structurally, BTC is still on the back foot: It’s trading below $88,000, and It remains below the 100-hour Simple Moving Average, keeping short-term trend pressure pointed downward. Resistance is layered, and $89,000 is the problem area(h3) If bulls try to turn this into a recovery, they’ll have to climb through multiple ceilings in quick succession. First, BTC faces resistance around $87,150, followed by a more meaningful barrier near $87,500. From there, the market’s attention snaps back to $88,000 — the level BTC just lost and now needs to reclaim. A close back above $88,000 would improve the tone, but it doesn’t solve the bigger issue: there’s a bearish trend line on the hourly BTC/USD chart (Kraken feed) with resistance near $89,000, which also lines up with the next technical hurdle. If BTC can push through $89,000 and hold, the rebound could extend toward $90,000, with follow-through targets at $91,000 and $91,500. But until price clears that $88,000–$89,000 zone, rallies are at risk of being sold rather than chased. If BTC fails to reclaim resistance, the downside path is clear(h3) The near-term bear case is simple: if Bitcoin can’t climb back above the $87,000 area and keep traction, sellers may attempt another leg lower. Support levels line up like this: Immediate support: $85,500 First major support: $85,000 Next support: $83,500 Then $82,500 in the near term Below that, the major “don’t break this” level is still $80,000. If BTC slips under $80,000, the risk of acceleration to the downside increases significantly — not because it’s magic, but because it’s the kind of psychological and structural level that tends to trigger forced de-risking. Indicators: momentum still leans bearish(h3) The intraday indicators aren’t offering much comfort yet: Hourly MACD is losing pace in the bearish zone. Hourly RSI remains below 50, suggesting sellers still have the upper hand on short timeframes. So while the $85,000 defense held for now, the market hasn’t flipped bullish — it’s just stopped bleeding.
    Author  Mitrade
    Dec 16, Tue
    Bitcoin has dropped back below $88,000 after rolling over from $90,500, with price still trading under the 100-hour Simple Moving Average. The sell-off found a floor at $85,151, and BTC is now consolidating near that base, but rebounds are facing pressure from a bearish trend line around $89,000. Bulls need to retake $88,000–$89,000 to ease downside risk; failure to do so keeps $85,500–$85,000 and then $83,500 in play, with $80,000 as the deeper “line in the sand.” Bitcoin (BTC) is back in damage-control mode after a sharp pullback wiped out recent gains. The price failed to reclaim the $90,000–$90,500 band, rolled over, and slid through $88,500 before briefly dipping under $87,000. Buyers did show up around $85,000, but the rebound so far looks more like stabilization than a clear trend reversal. Bitcoin dips hard, finds a bid near $85,000(h3) BTC’s latest move lower began when it couldn’t build follow-through above $90,000 and $90,500. Once that upside stalled, sellers took control and pushed price down through $88,500. The slide accelerated enough to spike below $87,000, but the market didn’t free-fall. Bulls defended the $85,000 zone, printing a low at $85,151. Since then, Bitcoin has been consolidating below the 23.6% Fibonacci retracement of the drop from the $93,560 swing high to the $85,151 low — a clue that the bounce is still shallow and that sellers haven’t fully backed off yet. Structurally, BTC is still on the back foot: It’s trading below $88,000, and It remains below the 100-hour Simple Moving Average, keeping short-term trend pressure pointed downward. Resistance is layered, and $89,000 is the problem area(h3) If bulls try to turn this into a recovery, they’ll have to climb through multiple ceilings in quick succession. First, BTC faces resistance around $87,150, followed by a more meaningful barrier near $87,500. From there, the market’s attention snaps back to $88,000 — the level BTC just lost and now needs to reclaim. A close back above $88,000 would improve the tone, but it doesn’t solve the bigger issue: there’s a bearish trend line on the hourly BTC/USD chart (Kraken feed) with resistance near $89,000, which also lines up with the next technical hurdle. If BTC can push through $89,000 and hold, the rebound could extend toward $90,000, with follow-through targets at $91,000 and $91,500. But until price clears that $88,000–$89,000 zone, rallies are at risk of being sold rather than chased. If BTC fails to reclaim resistance, the downside path is clear(h3) The near-term bear case is simple: if Bitcoin can’t climb back above the $87,000 area and keep traction, sellers may attempt another leg lower. Support levels line up like this: Immediate support: $85,500 First major support: $85,000 Next support: $83,500 Then $82,500 in the near term Below that, the major “don’t break this” level is still $80,000. If BTC slips under $80,000, the risk of acceleration to the downside increases significantly — not because it’s magic, but because it’s the kind of psychological and structural level that tends to trigger forced de-risking. Indicators: momentum still leans bearish(h3) The intraday indicators aren’t offering much comfort yet: Hourly MACD is losing pace in the bearish zone. Hourly RSI remains below 50, suggesting sellers still have the upper hand on short timeframes. So while the $85,000 defense held for now, the market hasn’t flipped bullish — it’s just stopped bleeding.
    placeholder
    Macro Analysts: Hawkish Japan Could Push Bitcoin Below $70KAnalysts predict Bitcoin may face further declines towards the $70,000 mark if the Bank of Japan raises interest rates as expected.
    Author  Mitrade
    Dec 15, Mon
    Analysts predict Bitcoin may face further declines towards the $70,000 mark if the Bank of Japan raises interest rates as expected.

    Bitcoin Related Articles

    • Trading Chart Patterns:Ultimate Guide to Price Action
    • How to Day Trade Crypto? Simplest Day Trading Strategy Ever
    • Places that Provide Cheapest Ways to Buy Bitcoin In 2025
    • 10 Best Crypto With Most Potential to Buy and invest in 2025 - Top Picks from Expert Traders
    • Top 10 Bitcoin Mining Apps for Android & iOS During 2024
    • How To Buy Bitcoin In Malaysia? Top 7 Best Crypto Exchanges & Trading Apps

    Click to view more