


- Gold Price Forecast: Gold Poised to Break $4,200 as Oil Price Slump Eases Inflation Fears
- Gold declines despite easing concerns over inflation, interest rate hikes
- Fed Decision Eve: 104 Economists Expect No Change; Why Is Citadel Securities Betting on a Surprise Hike?
- Gold Price Forecast: Can Gold Hold $4,020 as Fed Rate Hike Expectations Rise?
- Middle East War updates: US-Iran pause strikes as Trump weighs up diplomatic options
- WTI Oil flirts with the $80 level amid speculation about US-Iran peace talks

As Bitcoin’s (BTC) price fell below the $50,000 mark, panic ensued in the crypto market, leading to outflows of more than $300 billion in a day.
However, what follows this crash is the bigger question, as many are considering this a bottom and expecting a recovery. Is this a bottom, though?
Bitcoin Indicators Send Mixed Signals
Bitcoin’s price falling to an intra-day low of $48,974 on Monday got many thinking that the only way from here would be up, and that could be the case as well. Two major indicators, the first of which is the NVT Signal, are signaling a bottom at the moment.
The Network Value to Transaction (NVT) signal is used to assess the relationship between a cryptocurrency’s market capitalization and the volume of transactions on its network. Differing slightly from the NVT ratio, this indicator measures market cap against the 90-day moving average of daily transaction volume.
Generally, the indicator falling below 45 is considered an oversold condition and signals a bottom. However, at the moment, the signal is falling through the uptrend line by 23.2% in a week. This invalidated the uptrend line and also signaled a bottom, as the indicator is noting an uptick at the moment.
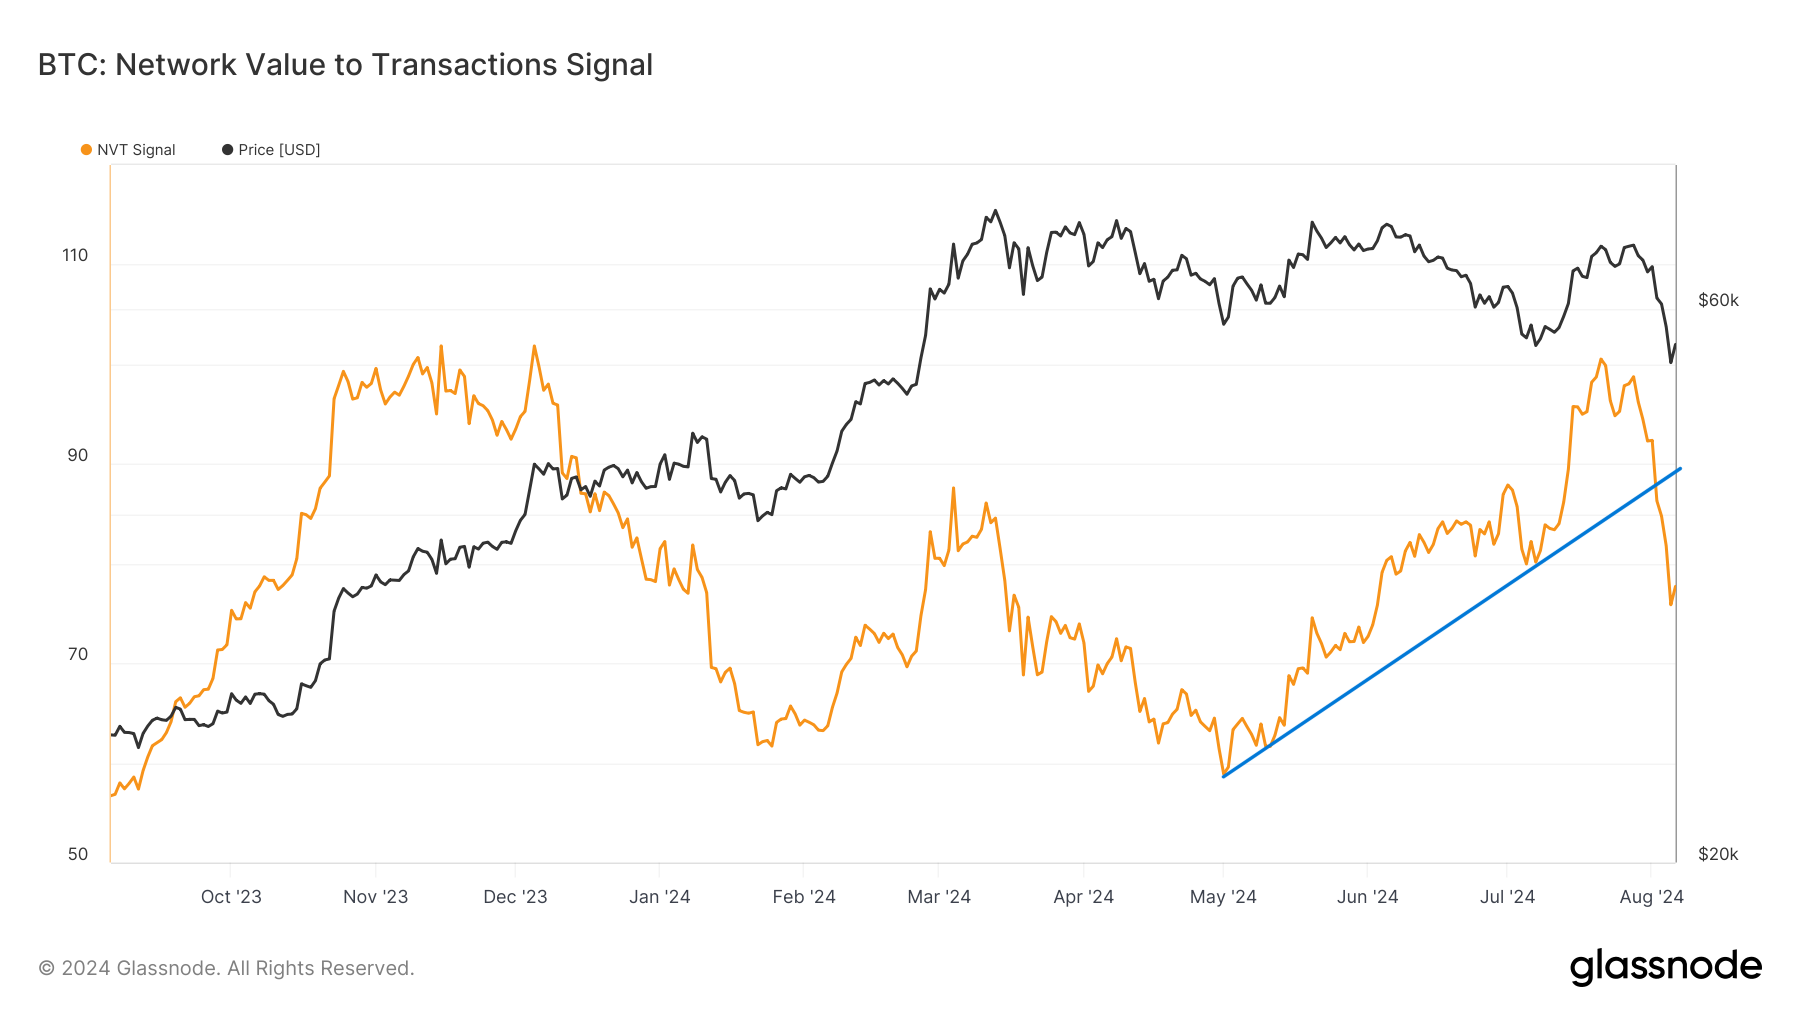 Bitcoin NVT Signal. Source: Glassnode
Another crucial signal is the Bitcoin Bull-Bear Market Cycle indicator, which does not signal an explicit bottom. As its name suggests, the indicator is used to assess the momentum building in the market.
Since late January 2023, the indicator has been exhibiting a bull market of varying intensities. However, for the first time since December 2021, the indicator is noting a bear market. This shows that bullishness has subsided, and bearishness is dominating the market.
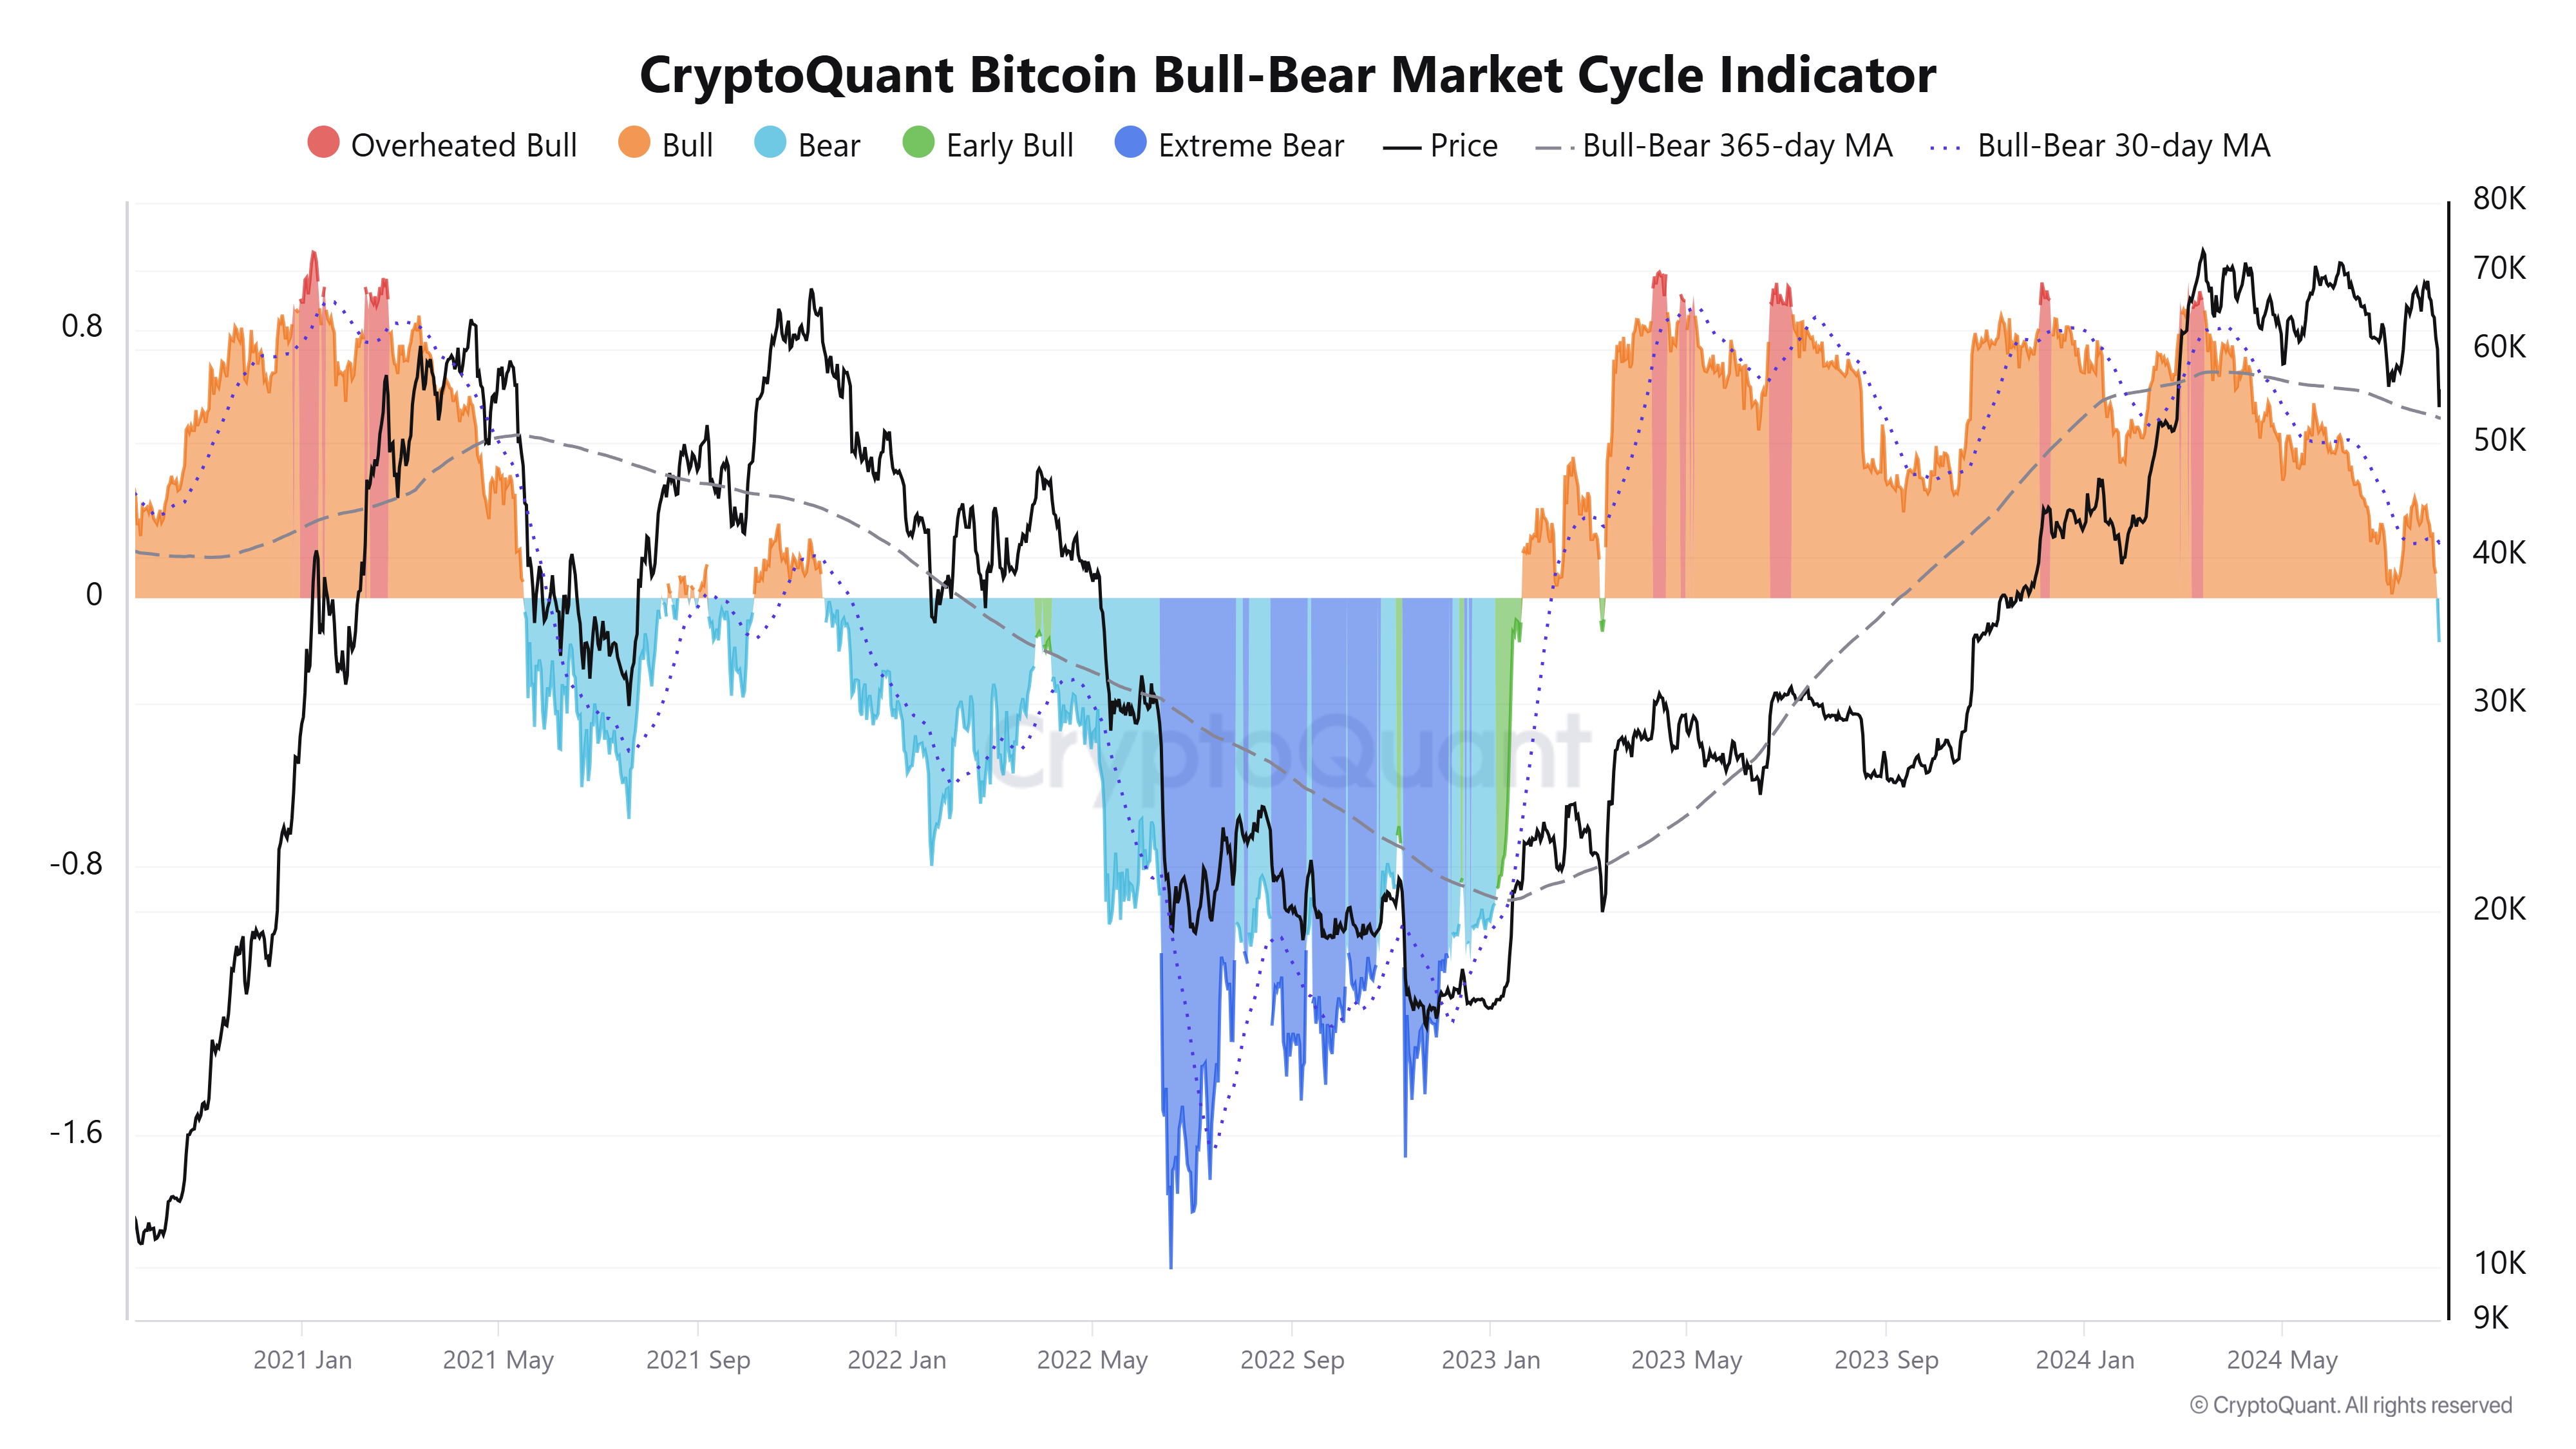 Bitcoin Bull-Bear Market Cycle Indicator. Source: CryptoQuant
BTC Price Prediction: Marking Its Presence
Bitcoin’s price is the second major indicator signaling a bottom as BTC closed above the bottom trend line of the broadening descending wedge at $54,000. This pattern has been consistently validated since early March and suggests a 21% rise upon breakout above $70,000.
While the intra-day low is $48,974, the recovery shows that BTC bottomed out to recover to the $54,000 mark. However, this pattern has also yet to be successful, and if the bullishness falters, the consolidation within the pattern could continue.
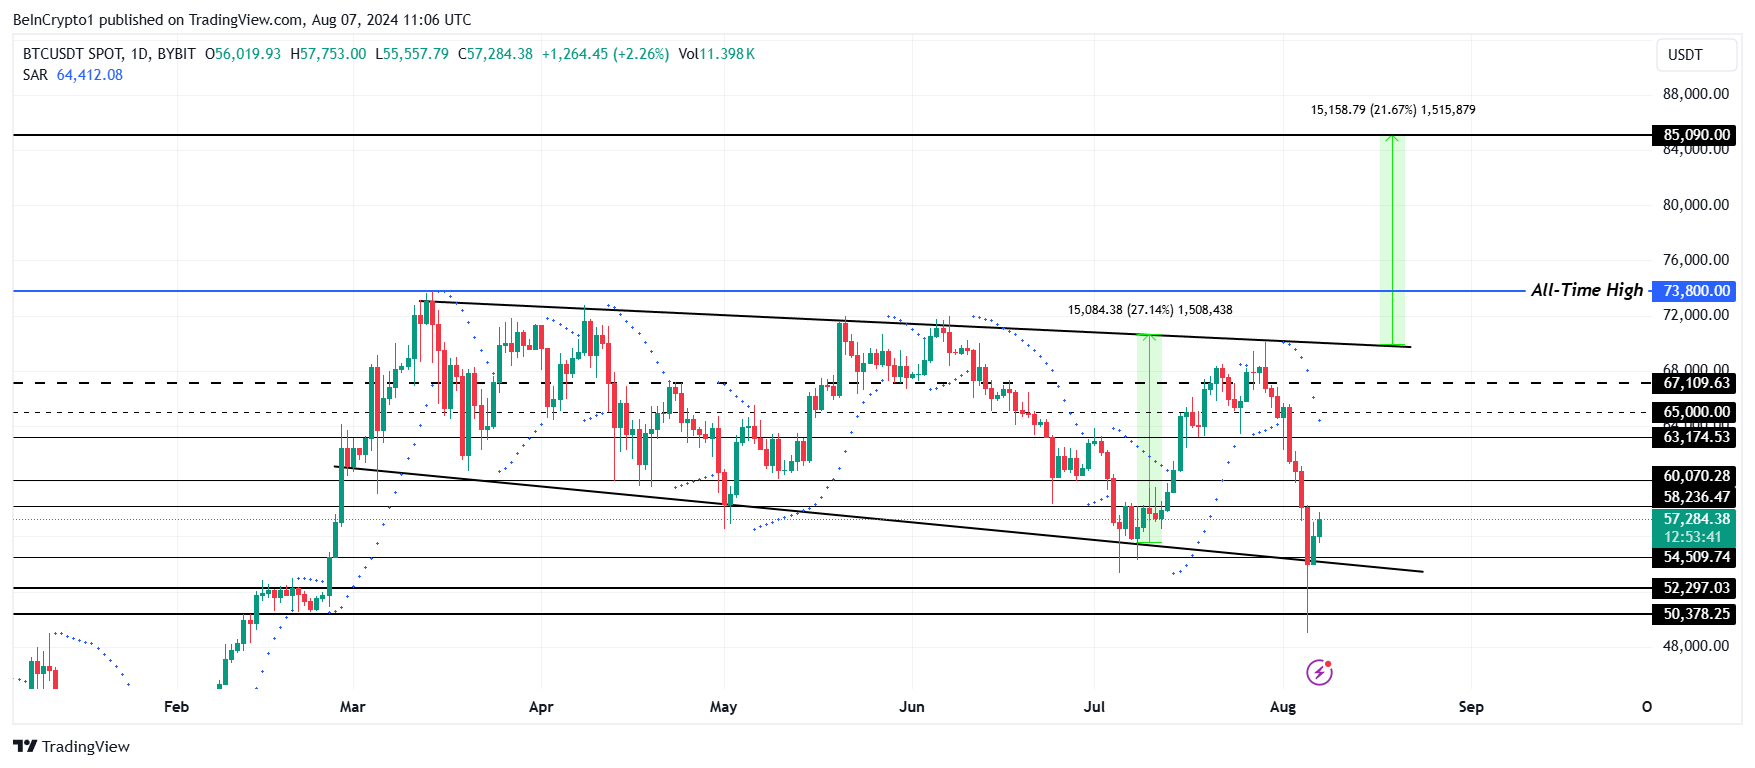 Bitcoin Price Analysis. Source: TradingView
This could extend Bitcoin’s oscillation between $68,000 or $70,000 and $54,000. As a result, the bullish thesis could be invalidated, and the possibility of a new all-time high diminishes.
Read more
* The content presented above, whether from a third party or not, is considered as general advice only. This article should not be construed as containing investment advice, investment recommendations, an offer of or solicitation for any transactions in financial instruments.


