Crude Oil shrugs off API stocks buildup, etches in another gain on Tuesday

Mitrade
coverImg
Source: DepositPhotos

■  WTI climbed back above $80.00 on Tuesday as bullish recovery continues.

■  Hopes of a summertime uptick in demand are bolstering Crude Oil bets.

■  Energy traders are shrugging off another barrel buildup in API Crude Oil barrel counts.


West Texas Intermediate (WTI) US Crude Oil broke decisively above $80.00 per barrel on Tuesday as barrel traders shrugged off another build-up in American Petroleum Institute (API) Weekly Crude Oil Stocks. Energy markets are betting on an upswing in fossil fuel demand heading into summer to sop up extra supply throughout global Crude Oil markets, even as the Organization of the Petroleum Exporting Countries (OPEC) and its extended network of non-member ally states, OPEC , prepares to axe voluntary production cuts that were meant to support Crude Oil prices and crimp global supply.


According to the API, US Weekly Crude Oil Stocks rose 2.264 million barrels for the week ended June 14, clamping down on the previous week’s -2.428 million barrel drawdown. Distillate Stocks also rose 538K barrels, though Gasoline Stocks Change declined 1.077 million barrels, though significantly less than the previous week’s -2.549 million barrel drawdown. Investors with a calculator nearby will note that this week’s 2.264 million barrel addition to API weekly counts brings the supply overhang of US Crude Oil to over 17 million barrels since the first week of January 2024.


Geopolitical turmoil continues to attack a fear premium to Crude Oil markets after a Ukranian drone strike successfully ignited a Russian fuel tank facility this week, and Israel-Palestinian tensions continue to simmer. Coupled with ambiguous hopes of a summertime uptick in demand, energy markets are shrugging off bearish factors, like US Crude Oil overproduction and disappointing Chinese demand figures last week.


WTI technical outlook


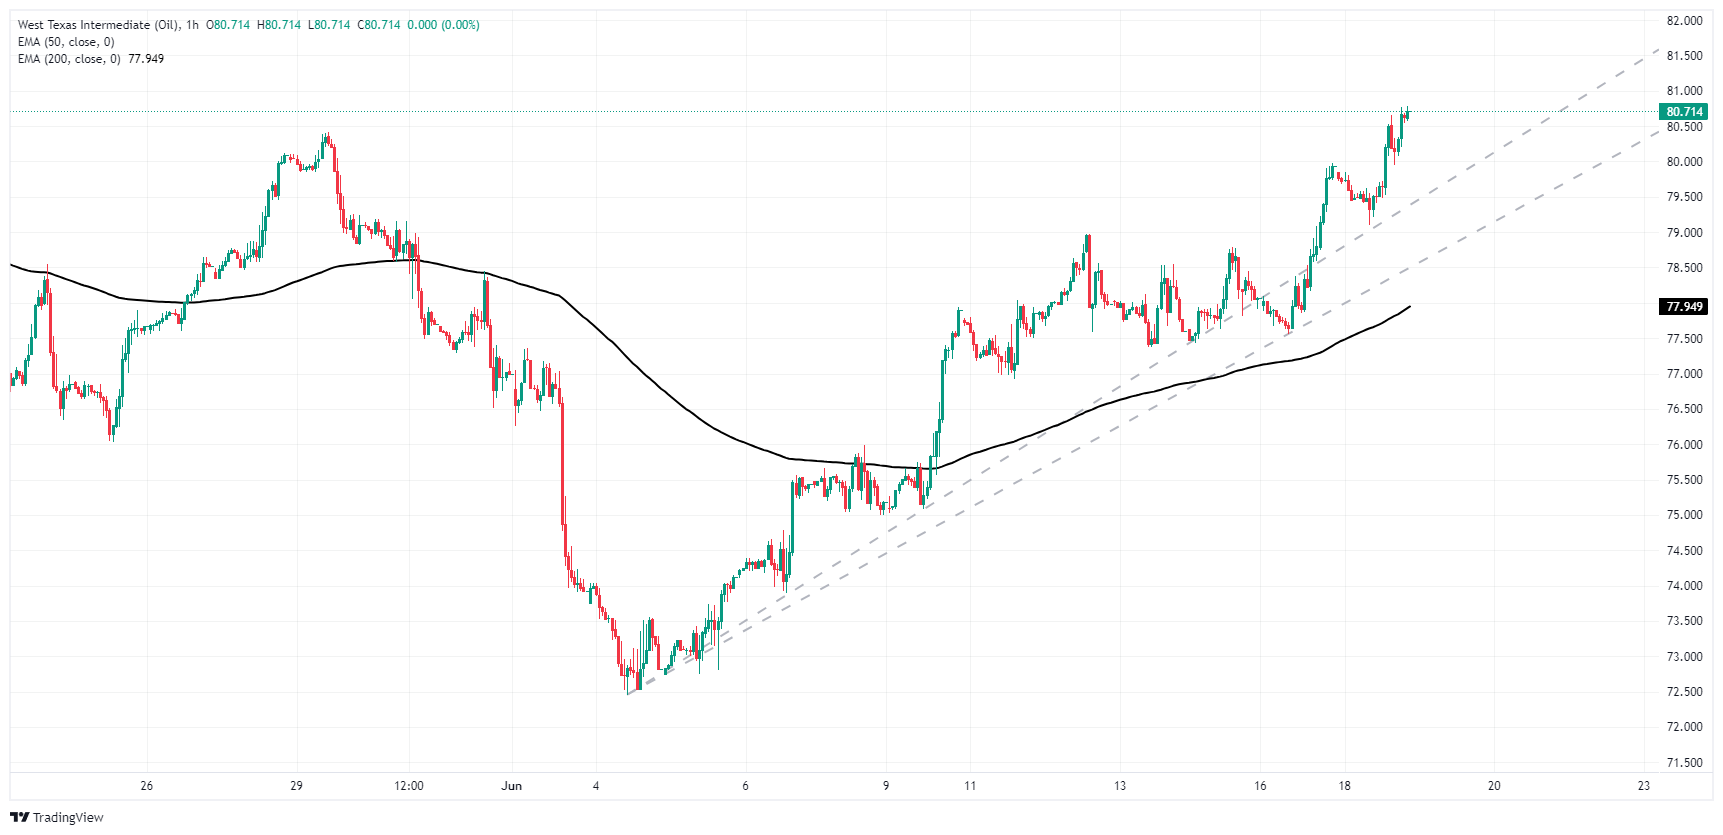
US Crude Oil is accelerating into bullish territory as WTI pushes off rising technical support from the last notable swing low into $72.50. WTI crossed over $80.50 on Tuesday to test $80.70 as barrel traders push prices higher in a bid to capture previously lost territory.


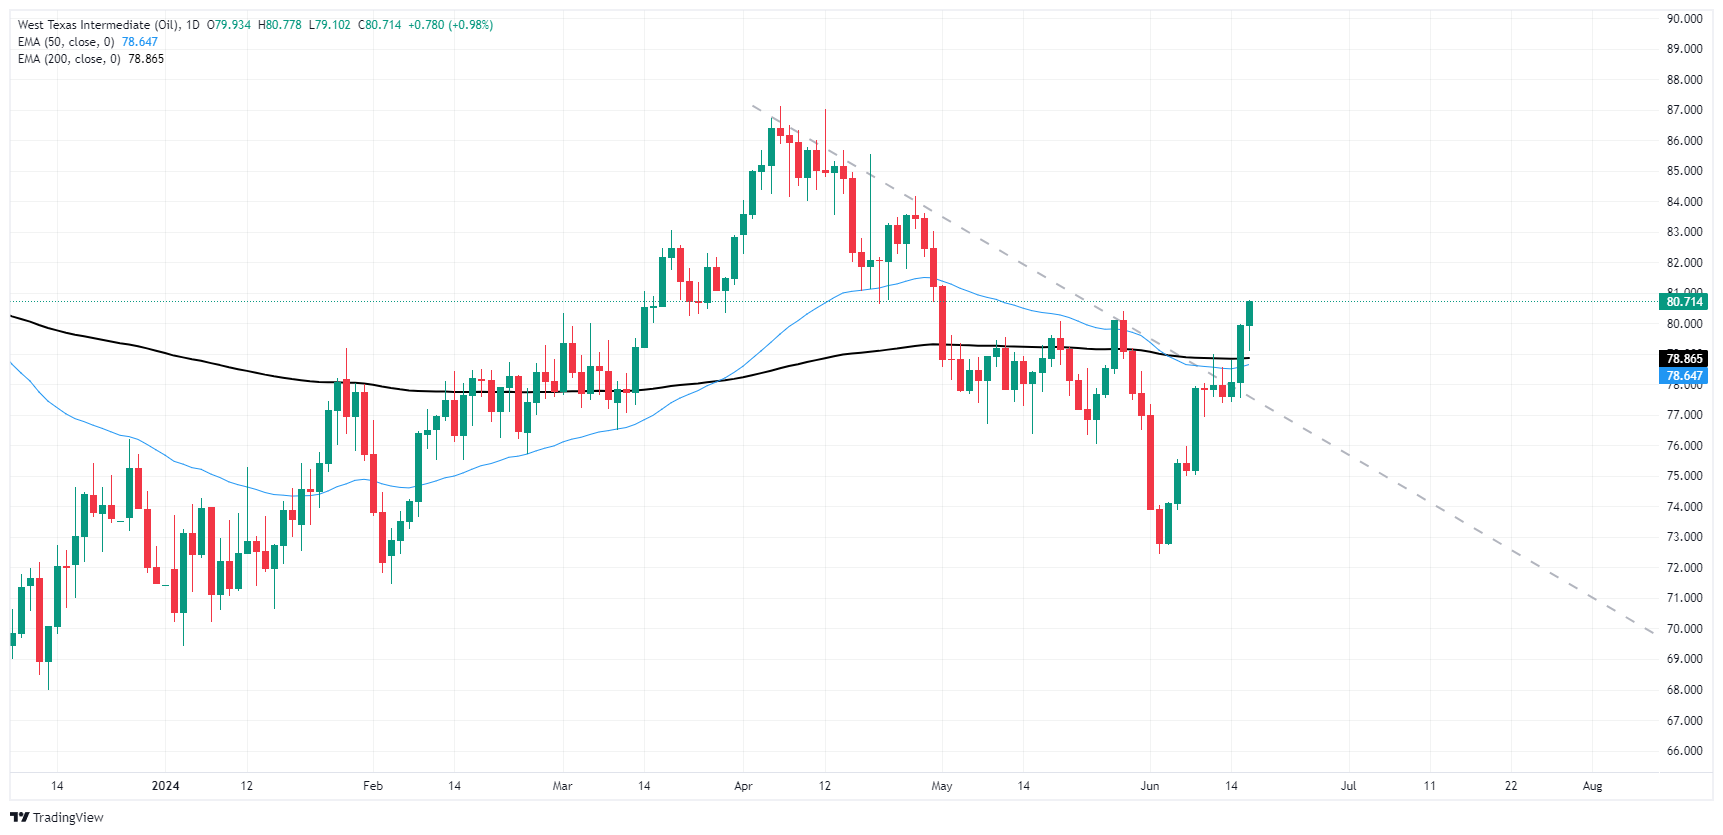
This week’s bullish push in WTI has sent US Crude Oil above the 200-day Exponential Moving Average (EMA) at $78.86. WTI has also cracked a descending trendline drawn from 2024’s peak bids near $87.00, and a failed push higher could drag WTI bids back down to the $76.00 region.


WTI hourly chart

WTI daily chart

WTI US OIL


Overview
Today last price 80.71
Today Daily Change 0.78
Today Daily Change % 0.98
Today daily open 79.93
 
Trends
Daily SMA20 77.15
Daily SMA50 79.58
Daily SMA100 79.28
Daily SMA200 79.15
 
Levels
Previous Daily High 79.97
Previous Daily Low 77.56
Previous Weekly High 78.98
Previous Weekly Low 75.03
Previous Monthly High 81.25
Previous Monthly Low 76.04
Daily Fibonacci 38.2% 79.05
Daily Fibonacci 61.8% 78.48
Daily Pivot Point S1 78.34
Daily Pivot Point S2 76.74
Daily Pivot Point S3 75.92
Daily Pivot Point R1 80.75
Daily Pivot Point R2 81.57
Daily Pivot Point R3 83.17

Read more

  • Silver Price Forecast: XAG/USD falls like house of cards on Fed’s hawkish narrative
  • Gold Falls Below $4,200 in Single-Day Drop of Over $100: Why Are Gold Prices Plunging?
  • Middle East War updates: Trump says he expects renewed Iran talks this week
  • * The content presented above, whether from a third party or not, is considered as general advice only.  This article should not be construed as containing investment advice, investment recommendations, an offer of or solicitation for any transactions in financial instruments.

    goTop
    quote
    Related Articles
    placeholder
    Brent edges toward $99 as Trump rejects Iran's Hormuz proposal — why the war-risk premium won't rebuildBrent crude rose 0.92% to $98.51 and WTI gained 1.15% to $93.51 after President Trump rejected Iran's seven-day proposal to reopen the Strait of Hormuz. But both benchmarks remain about 12% below their early-September highs, because supply never actually stopped. Hormuz flows ran at 33.7 million barrels this week, in line with the prior week, and Saudi Arabia's East-West pipeline restarted on September 22.
    Author  Suzie
    21 hours ago
    Brent crude rose 0.92% to $98.51 and WTI gained 1.15% to $93.51 after President Trump rejected Iran's seven-day proposal to reopen the Strait of Hormuz. But both benchmarks remain about 12% below their early-September highs, because supply never actually stopped. Hormuz flows ran at 33.7 million barrels this week, in line with the prior week, and Saudi Arabia's East-West pipeline restarted on September 22.
    placeholder
    Middle East War updates: Trump says he expects renewed Iran talks this weekHere’s a brief recap of the key developments in the Middle East war that occurred over the weekend, which are expected to have a significant impact on markets in the upcoming week.
    Author  FXStreet
    Yesterday 01: 30
    Here’s a brief recap of the key developments in the Middle East war that occurred over the weekend, which are expected to have a significant impact on markets in the upcoming week.
    placeholder
    WTI (USOIL) Is down 2.03% on Sep 25: Here Is WhyWTI (USOIL) is down 2.03% at Sep 24 22:20(UTC+0), now at $92.517, with a 7-day down of 3.63%.What is driving WTI (USOIL)’s stock price down today?The drop in WTI crude oil prices was primarily driven by
    Author  TradingKey
    Sep 25, Fri
    WTI (USOIL) is down 2.03% at Sep 24 22:20(UTC+0), now at $92.517, with a 7-day down of 3.63%.What is driving WTI (USOIL)’s stock price down today?The drop in WTI crude oil prices was primarily driven by
    placeholder
    US input costs rose at the fastest pace in four years — the September flash PMI beat is an inflation story, not a growth storyUS September flash PMIs came in far above expectations, with the composite at 58.4, a five-year high. But the detail that moved markets was input cost inflation at its fastest since October 2022, driven by fuel, transport and supply shortages. Brent is back above $100 and the 10-year Treasury yield has hit its highest since 2007.
    Author  Suzie
    Sep 24, Thu
    US September flash PMIs came in far above expectations, with the composite at 58.4, a five-year high. But the detail that moved markets was input cost inflation at its fastest since October 2022, driven by fuel, transport and supply shortages. Brent is back above $100 and the 10-year Treasury yield has hit its highest since 2007.
    placeholder
    US Special Envoy Witkoff says mediators completed round of US-Iran talksUnited States (US) Special Envoy to the Middle East, Steve Witkoff, said the US held "lengthy" indirect talks with the Iranian delegation via mediators on the sidelines of the United Nations General Assembly (UNGA), Reuters reported on Tuesday.
    Author  FXStreet
    Sep 23, Wed
    United States (US) Special Envoy to the Middle East, Steve Witkoff, said the US held "lengthy" indirect talks with the Iranian delegation via mediators on the sidelines of the United Nations General Assembly (UNGA), Reuters reported on Tuesday.
    Live Quotes
    Name / SymbolChart% Change / Price
    USOIL
    USOIL
    0.00%0.00
    UKOIL
    UKOIL
    0.00%0.00
    USDOLLAR-F
    USDOLLAR-F
    0.00%0.00

    Oil Related Articles

    • Best Oil Trading Platforms in 2026: A Complete Guide for Retail Traders
    • Should I Invest in Oil Right Now? The 2026 Oil Price Forecast
    • Crude Oil Trading: How To Invest In WTI/Brent Oil?
    • WTI Moves Upward Near $75.50 on Dovish Fed Outlook, Maersk, CMA CGM Return to Red Sea

    Click to view more