

Silver Rises to Multi-Week High, Above 50% Fibonacci Retracement of August-September Decline

- Gold Price Forecast: Gold Poised to Break $4,200 as Oil Price Slump Eases Inflation Fears
- Gold Price Forecast: Oil Price Breaking $100 Fuels Inflation Concerns, Will Gold Prices Fall Further?
- Middle East War updates: US-Iran pause strikes as Trump weighs up diplomatic options
- WTI climbs above $87.00 as Middle East conflict threatens key choke points
- Today’s Market Recap: Oil Breaks $100, Fueling Inflation Fears, as AI Capex Faces Scrutiny and Tesla’s 14% Plunge Drags Down Tech Sector
- WTI Crude Breaks $90, Brent Crude Approaches $100, Middle East Shipping Risks Drive Continuous Rise in Oil Prices

Silver continued its ascent on Friday, reaching a nearly three-week high and breaking above the 50% Fibonacci retracement level. This breakthrough may establish a foundation for further upside, with potential support found near the confluence point at $23.30.
Building on its steady recovery from the $22.80 region (this week's low), silver gained strong momentum on Friday. This marks the metal's third consecutive bullish close and the fifth bullish day in the last six trading days. During the early European session, silver surged to around $23.75, its highest level in two and a half weeks.
From a technical standpoint, surpassing the 50% Fibonacci retracement level of the August-September decline is seen as a new trigger point for silver/USD bulls. Additionally, the oscillators on the daily chart have just started moving into positive territory, supporting the prospect of further appreciation. Therefore, there is a high possibility of reclaiming the key psychological level of $24.00 (along with the 61.8% Fibonacci retracement level).
Follow-up buying could lay the groundwork for an extension of the recent upward trendline stemming from the June swing low. In that case, silver/USD could accelerate its rise, breaking through the intermediate barrier at $24.30-$24.35 and targeting the psychological level of $25.00 or the monthly swing high from August. The next relevant resistance level lies near the July peak around $25.25, and a decisive break above it would pave the way for further gains.
On the other hand, any meaningful downside correction seems likely to find suitable support near the confluence point at $23.30. This confluence includes the 200-period simple moving average (SMA) on the 4-hour chart and the 38.2% Fibonacci level. The next relevant support level is near the round figure of $23.00. If breached, silver/USD could retreat to retest the $22.30 support or last week's low touched on Thursday. A successful break below that level would benefit bearish traders.
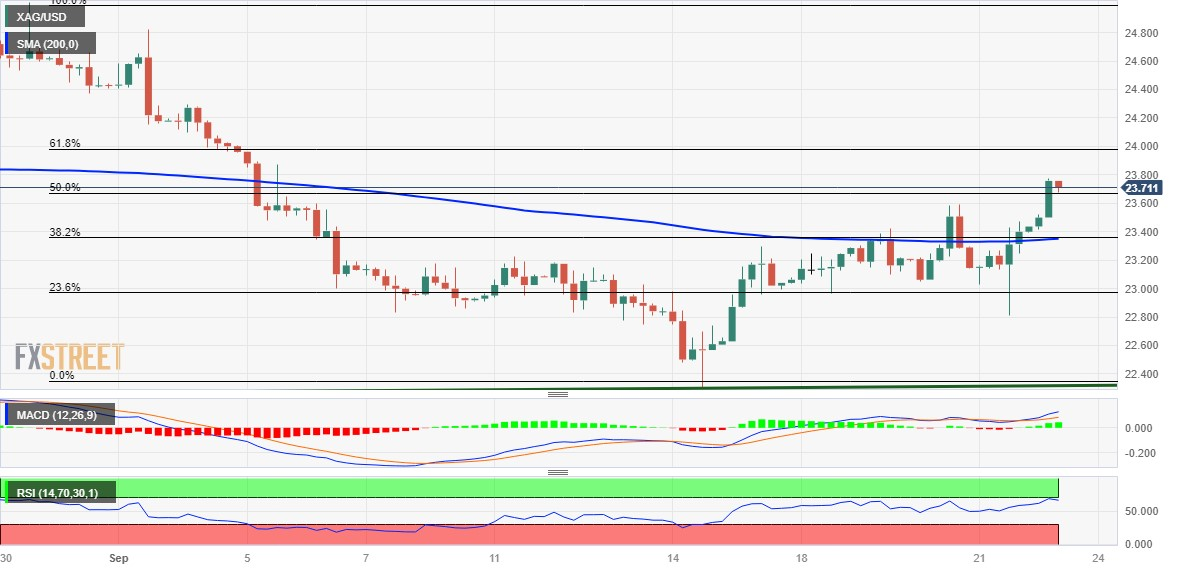
(Source: FXstreet, 4-hour chart of silver)
Read more
* The content presented above, whether from a third party or not, is considered as general advice only. This article should not be construed as containing investment advice, investment recommendations, an offer of or solicitation for any transactions in financial instruments.


