

Gold price dips slightly amid soft US Dollar, lower US yields

- Gold Price Forecast: Gold Poised to Break $4,200 as Oil Price Slump Eases Inflation Fears
- Gold declines despite easing concerns over inflation, interest rate hikes
- Fed Decision Eve: 104 Economists Expect No Change; Why Is Citadel Securities Betting on a Surprise Hike?
- Gold Price Forecast: Can Gold Hold $4,020 as Fed Rate Hike Expectations Rise?
- Middle East War updates: US-Iran pause strikes as Trump weighs up diplomatic options
- WTI Oil flirts with the $80 level amid speculation about US-Iran peace talks
■Gold retreats modestly after failing to sustain gains despite fall in US Treasury yields, weaker US Dollar.
■XAU/USD struggles to capitalize following release of weaker-than-expected S&P Global PMIs, fueling speculation about potential Fed rate cuts.
■Geopolitical tensions ease somewhat, impacting Gold's role as a safe-haven asset in times of turmoil.
Gold price posted modest losses late Tuesday in the North American session after reaching a high of $2,334, sponsored by a weaker-than-expected S&P Global Purchasing Managers Index (PMI) report. Buyers haven’t been able to capitalize on the Greenback weakness, while US Treasury yields dropped from the short end to the belly of the yield curve.
XAU/USD trades at $2,323, down 0.11%. The US 10-year Treasury yield stays firm at 4.402%, while the US real yields, which correlate inversely to Gold prices, drop 0.41% to 2.192%, a tailwind for the golden metal.
Geopolitical risks, despite lingering in traders' minds, calmed following Iran’s attack on Israel and the latter’s retaliation. Data from S&P Global reignited rate cut hopes among investors following last week's hawkish rhetoric implemented by Federal Reserve (Fed) officials led by Chairman Jerome Powell. One of the most dovish members of the FOMC, Chicago Fed Austan Goolsbee, echoed his comments, adding that progress on inflation has “stalled.”
Daily digest market movers: Gold remains steady, though tilted to downside following Monday's slump
S&P Global revealed that US business activity in the manufacturing sector shrank. This month, the Manufacturing PMI dived from 51.9 to 49.9. On the other hand, the Services and Composite Index decelerated from 51.7 and 52.1 to 50.9 in both readings.
Other data showed that New Home Sales jumped to a six-month high, according to the US Department of Commerce, while Building Permits remained in contractionary territory despite being revised up from -4.3% to -3.7%.
US Dollar Index (DXY), which tracks the buck’s performance against a basket of six other currencies, plunges 0.44% to 105.68.
This week, the economic docket in the United States (US) will feature the release of the Gross Domestic Product (GDP) for the first quarter of 2024. Analysts estimate that GDP grew 2.5%, down from Q4 2023’s 3.4%.
Also, the US Bureau of Economic Analysis would reveal the preferred inflation gauge of the Fed, the March Personal Consumption Expenditure (PCE) Price Index. A softer reading than expected could prompt Gold traders to buy the yellow metal and aim to refresh all-time highs. Otherwise, a rise in prices could underpin US Treasury yields and the Greenback, a headwind for the non-yielding metal.
The PCE is expected to edge higher, while the Core PCE is expected to decrease from 2.8% to 2.6% YoY.
Data from the Chicago Board of Trade (CBOT) suggests that traders expect the fed funds rate to finish 2024 at 4.955%, down from Monday's 4.99%.
Technical analysis: Gold price is at risk of diving beneath $2,300
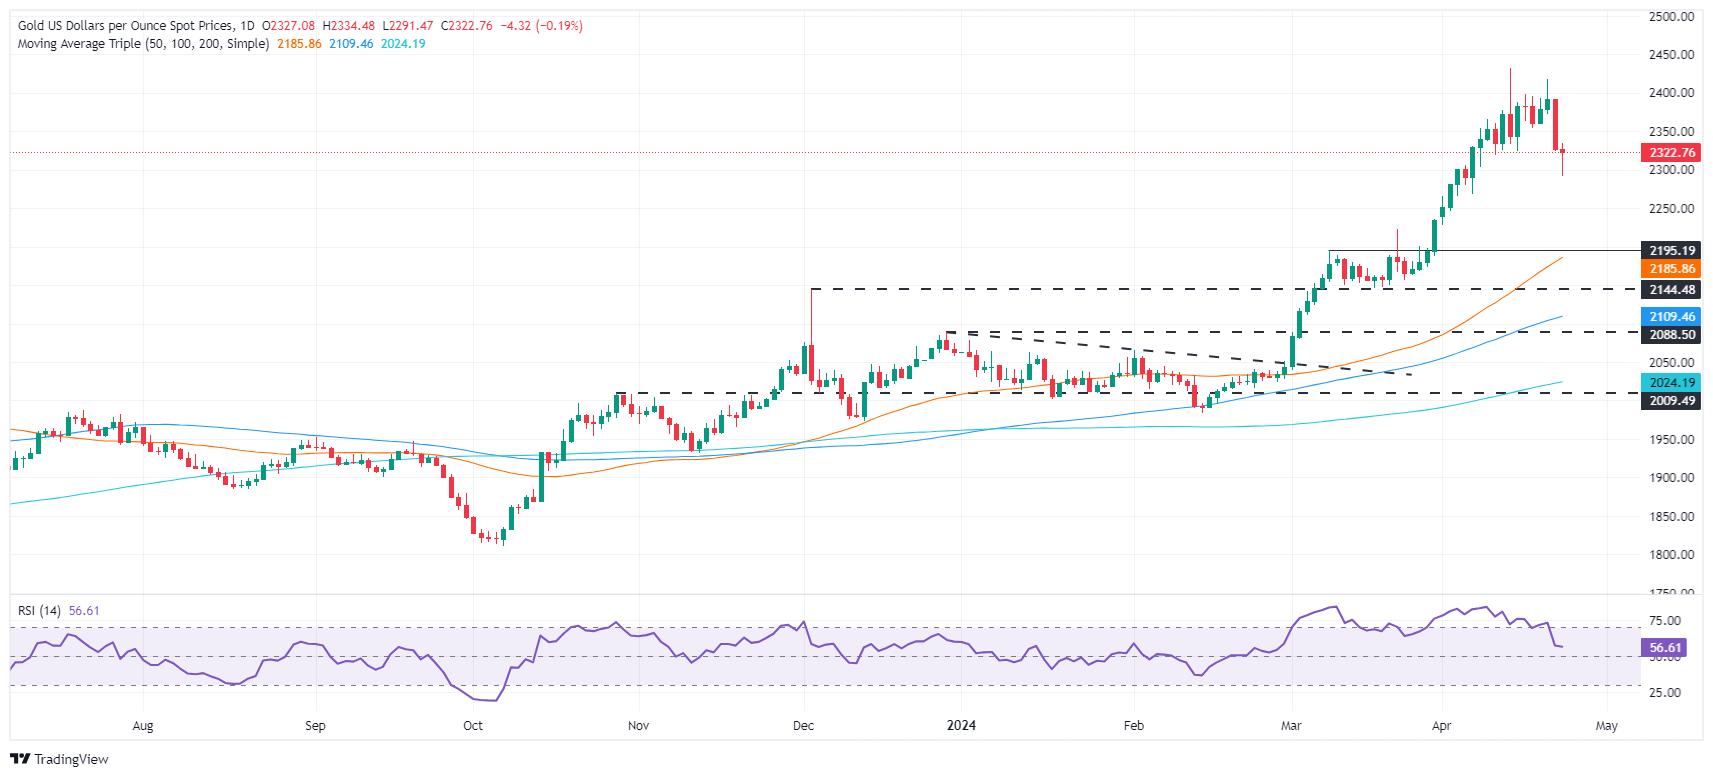
After diving on Monday and forming a “bearish engulfing” chart pattern, the Gold price hit a two-week low of $2,291. However, XAU/USD buyers push prices above the $2,300 figure, but they’re not out of the woods yet. For them to stay in charge, they must lift Gold above the $2,350 psychological level, which could pave the way to challenge $2,400.
If they surpass that level, up next would be last Friday’s high of $2,417, followed by the all-time high of $2,431.
On the other hand, if XAU/USD sellers achieve a daily close below the April 15 daily low of $2,324, that would pave the way to test $2,300. A breach of the latter will expose the March 21 high at $2,222.
Read more
* The content presented above, whether from a third party or not, is considered as general advice only. This article should not be construed as containing investment advice, investment recommendations, an offer of or solicitation for any transactions in financial instruments.


