


Gold price bulls retain control near one-month top, move beyond $2,700 awaited


Gold prices continue to draw support from bets for more interest rate cuts by the Fed.
Concerns about Trump’s trade tariff plans also benefit the safe-haven precious metal.
The risk-on mood and a modest USD uptick cap the upside for the XAU/USD pair.
Gold price (XAU/USD) touches a fresh one-month top during the Asian session on Thursday, though it struggles to build on the momentum beyond the $2,700 mark. Against the backdrop of easing fears about US President-elect Donald Trump's disruptive trade tariffs, bets that the Federal Reserve (Fed) could cut interest rates twice this year remain supportive of the upbeat market mood. Apart from this, a modest US Dollar (USD) uptick turns out to be a key factor keeping a lid on the safe-haven precious metal.
Meanwhile, signs of abating inflationary pressures in the US suggest that the Fed may not necessarily exclude the possibility of cutting rates further by the end of this year. This led to the overnight slump in the US Treasury bond yields, which might cap the USD and support the non-yielding Gold price. Moreover, uncertainties around Trump's tariff plan and its potential impact on global growth should help limit any meaningful downside for the commodity. Traders now look to the US macro data for short-term impetus.
Gold price sticks to bullish bias as cooler US inflation data revives Fed rate cut bets
Bloomberg reported earlier this week that the incoming US President Donald Trump's economic advisers are considering a program to gradually increase tariffs month by month.
Moreover, cooler-than-expected inflation data from the US revived expectations that the Federal Reserve's policy easing cycle may not be over yet and underpins the Gold price.
The US Bureau of Labor Statistics (BLS) reported that the headline CPI rose 0.4% in December and the yearly rate accelerated to 2.9% from 2.7% recorded in the previous month.
Meanwhile, the core gauge, which excludes volatile food and energy prices, rose 3.2% on a yearly basis as compared to the 3.3% increase in November and consensus estimates.
The markets were quick to react and now expect the Fed to deliver 40 basis points (bps) rate cuts by year-end, compared with about 31 bps before the December inflation data.
The yield on the benchmark 10-year US government bond retreated further away from the 14-month high touched on Monday, dragging the US Dollar to a fresh one-week low.
Investors, however, seem convinced that the Fed will pause its rate-cutting cycle later this year, which helps revive the USD demand and contributes to capping the XAU/USD.
Richmond Fed President Tom Barkin said that fresh inflation data show progress on lowering inflation to the central bank's 2% goal, but added that rates should remain restrictive.
Ukraine carried out its most massive attack, targeting military and oil facilities deep inside Russia, with drones and missiles, including US-made ATACMS ballistic missiles.
In response, Russia launched its own bombardment, predominantly targeting Ukraine’s gas infrastructure and energy facilities with more than 40 missiles and 70 attack drones.
Qatar’s Prime Minister said on Wednesday that Israel and Hamas agreed to a ceasefire in Gaza and exchange Israeli hostages for Palestinian prisoners after 15 months of war.
Traders now look to the US economic docket – featuring monthly Retail Sales and the usual Weekly Initial Jobless Claims – for a fresh impetus later during the North American session.
Gold price remains on track to climb further towards testing the $2,715-2,720 hurdle
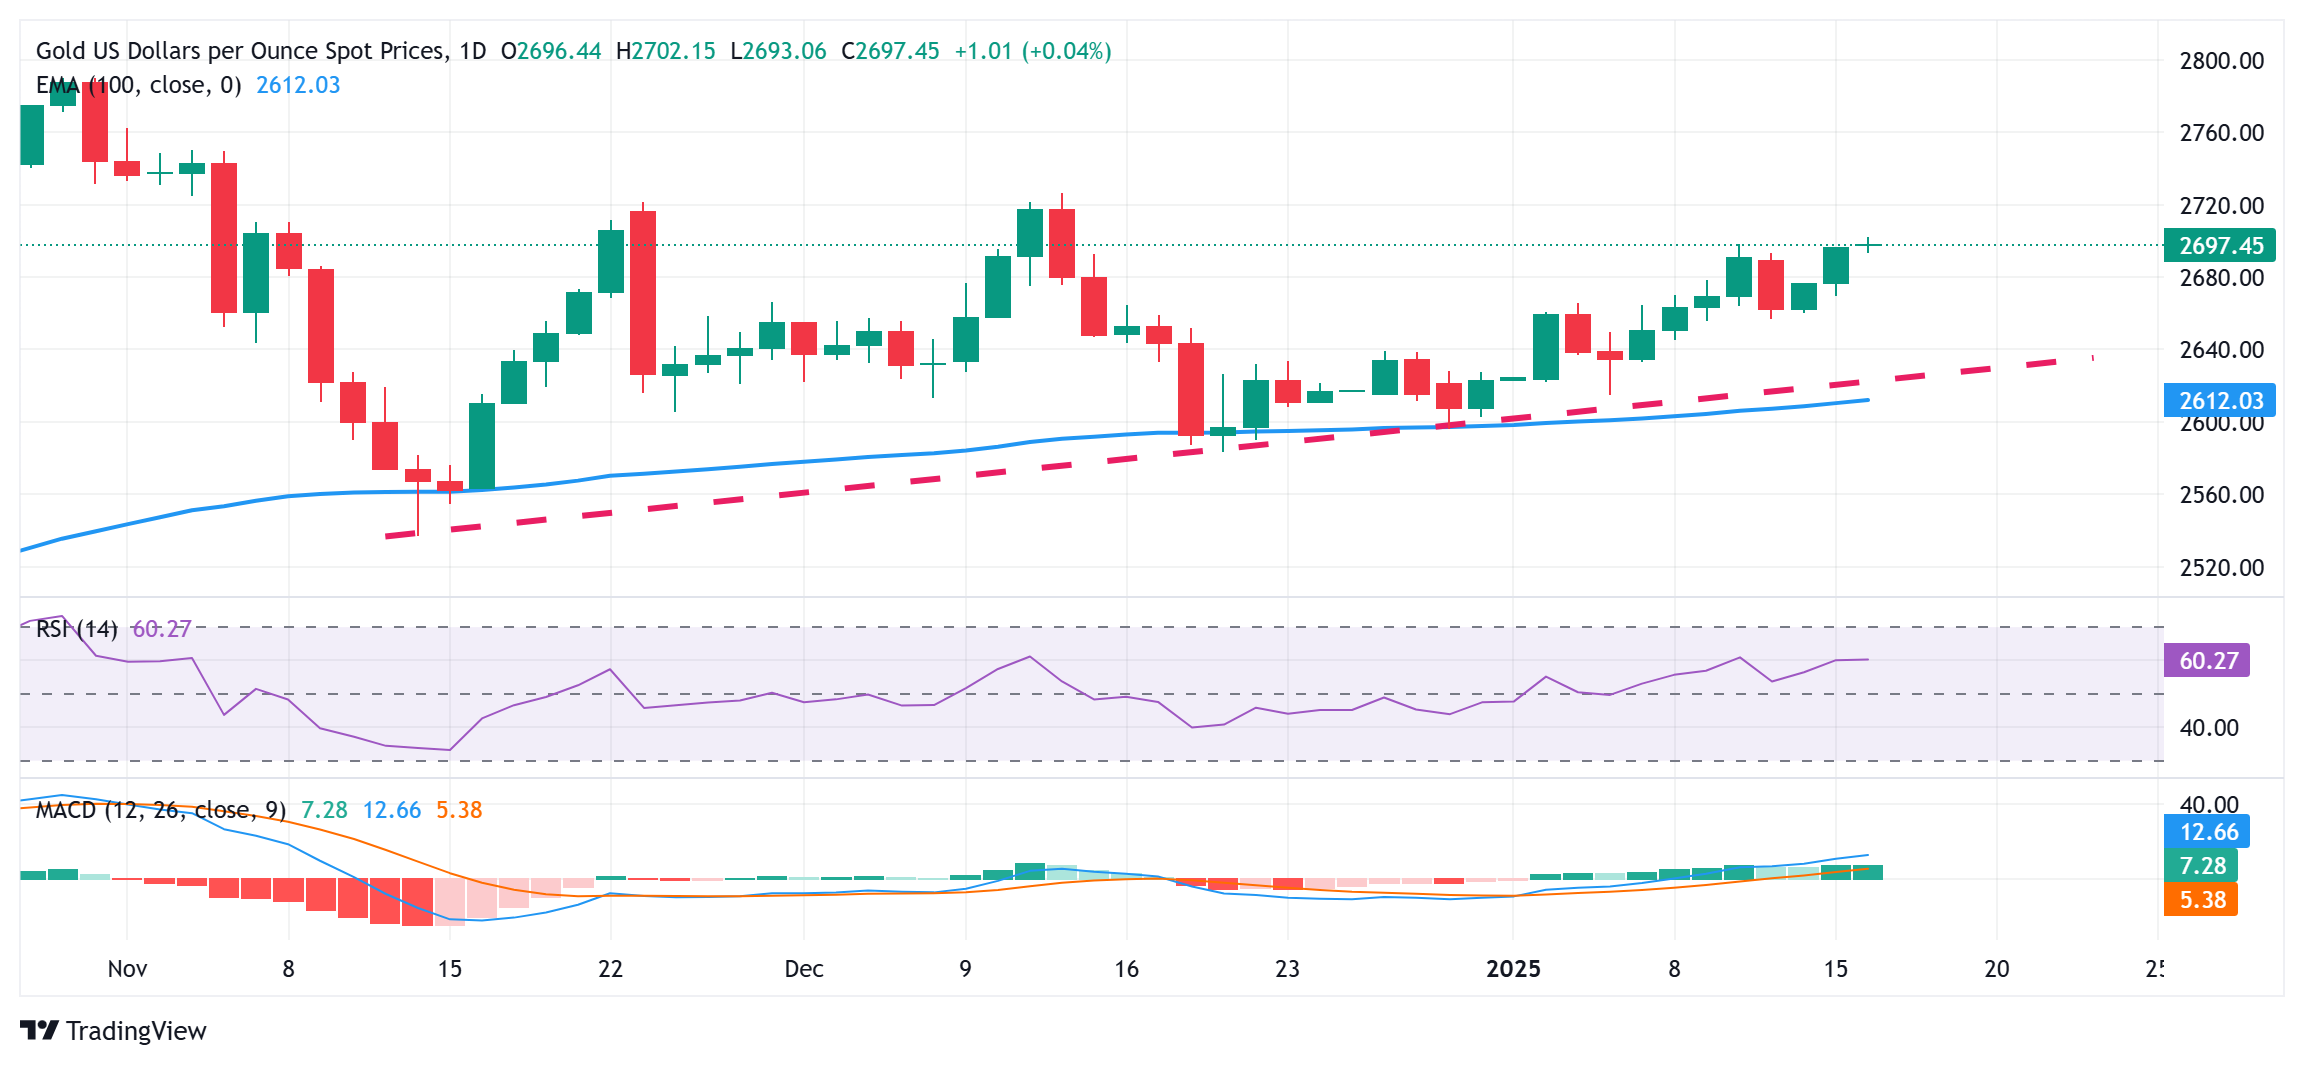
From a technical perspective, positive oscillators on the daily chart support prospects for a further move-up towards the $2,715-2,720 supply zone. Some follow-through buying should pave the way for additional gains towards the next relevant hurdle near the $2,748-2,750 region, above which the Gold price could aim to retest the all-time peak, around the $2,790 area touched in October 2024.
On the flip side, any meaningful pullback now seems to find decent support and attract fresh buyers around the $2,678 region. This should help limit the downside near the $2,664-2,663 horizontal zone. Failure to defend the said support levels could make the Gold price vulnerable to accelerate the fall towards the $2,635 area en route to the $2,615 confluence – comprising a short-term ascending trend line and the 100-day Exponential Moving Average (EMA).
Read more
* The content presented above, whether from a third party or not, is considered as general advice only. This article should not be construed as containing investment advice, investment recommendations, an offer of or solicitation for any transactions in financial instruments.


