

Gold trades higher as central banks start rate-cutting cycle

- Gold Price Forecast: Gold Poised to Break $4,200 as Oil Price Slump Eases Inflation Fears
- Gold Price Forecast: Oil Price Breaking $100 Fuels Inflation Concerns, Will Gold Prices Fall Further?
- Gold rallies to over two-week high, eyes $4,150 as traders track US-Iran diplomacy efforts
- Middle East War updates: US-Iran pause strikes as Trump weighs up diplomatic options
- WTI climbs above $87.00 as Middle East conflict threatens key choke points
- Today’s Market Recap: Oil Breaks $100, Fueling Inflation Fears, as AI Capex Faces Scrutiny and Tesla’s 14% Plunge Drags Down Tech Sector

■Gold trades higher as bets the Fed will cut rates in September remain elevated despite strong US service sector data.
■The BoC has cut interest rates, the ECB is likely to on Thursday, the SNB could later in June – all positives for non-yielding Gold.
■Gold breaks out of its range higher, muddying the short-term technical picture.
Gold (XAU/USD) is trading up around a quarter of a percent in the $2,360s on Thursday. The move comes as a result of continued elevated expectations that the Federal Reserve (Fed) will cut interest rates as soon as September, despite the release of higher-than-expected US Institute for Supply Management’s (ISM) Services PMI data on Wednesday.
Gold rises as markets anticipate lower interest rates
Gold pushes higher on Thursday as investors continue to bet on the Fed cutting interest rates, with the probabilities standing at 69% that the rate being lower than the current level in September, based on the CME FedWatch tool, which bases its estimates on 30-day US Fed Fund Futures pricing data. The anticipation of lower interest rates is positive for Gold as it reduces the opportunity cost of holding the non-yielding asset.
Globally, interest rate expectations are falling. On Wednesday, the Bank of Canada (BoC) cut its overnight rate to 4.75% from 5.00%; the European Central Bank (ECB) is widely expected to cut its key interest rate by 0.25% to 4.25% at its policy meeting today (Thursday). After the release of lower inflation data in Switzerland, speculation is also rising for the Swiss National Bank (SNB) to cut its key rate when it makes its decision on June 20.
Service sector data ends poor run, Nonfarm Payrolls eyed
The outlook for the US economy gained a lift on Wednesday after a combination of higher-than-expected ISM Services PMI data for May and tech-sector optimism. The move led to a rebound in the US Dollar (USD).
US employment data on Friday is keenly awaited and could impact Gold price. The US Nonfarm Payrolls (NFP) report is expected to show a rise of 185K in May, however, negative JOLTS Job Openings data and a lower-than-expected ADP Employment Change this week have reduced investor-optimism regarding the US Bureau of Labor Statistics report.
If the NFPs also show weakness, it would probably weigh on the USD and further increase bets the Fed will cut interest rates early, providing a backwind to Gold price.
Technical Analysis: Gold breaks out of range, bringing downtrend into doubt
Gold price has broken out of the mini-range that stretches between $2,315 and $2,358. The upside break brings the short-term downtrend into doubt and could mark a reversal.
XAU/USD’s break above the range high generates a target at $2,385, the 0.618 Fibonacci extrapolation of the height of the range from the breakout point higher. A move above $2,375 would increase confirmation the target will get hit.
XAU/USD 4-hour Chart
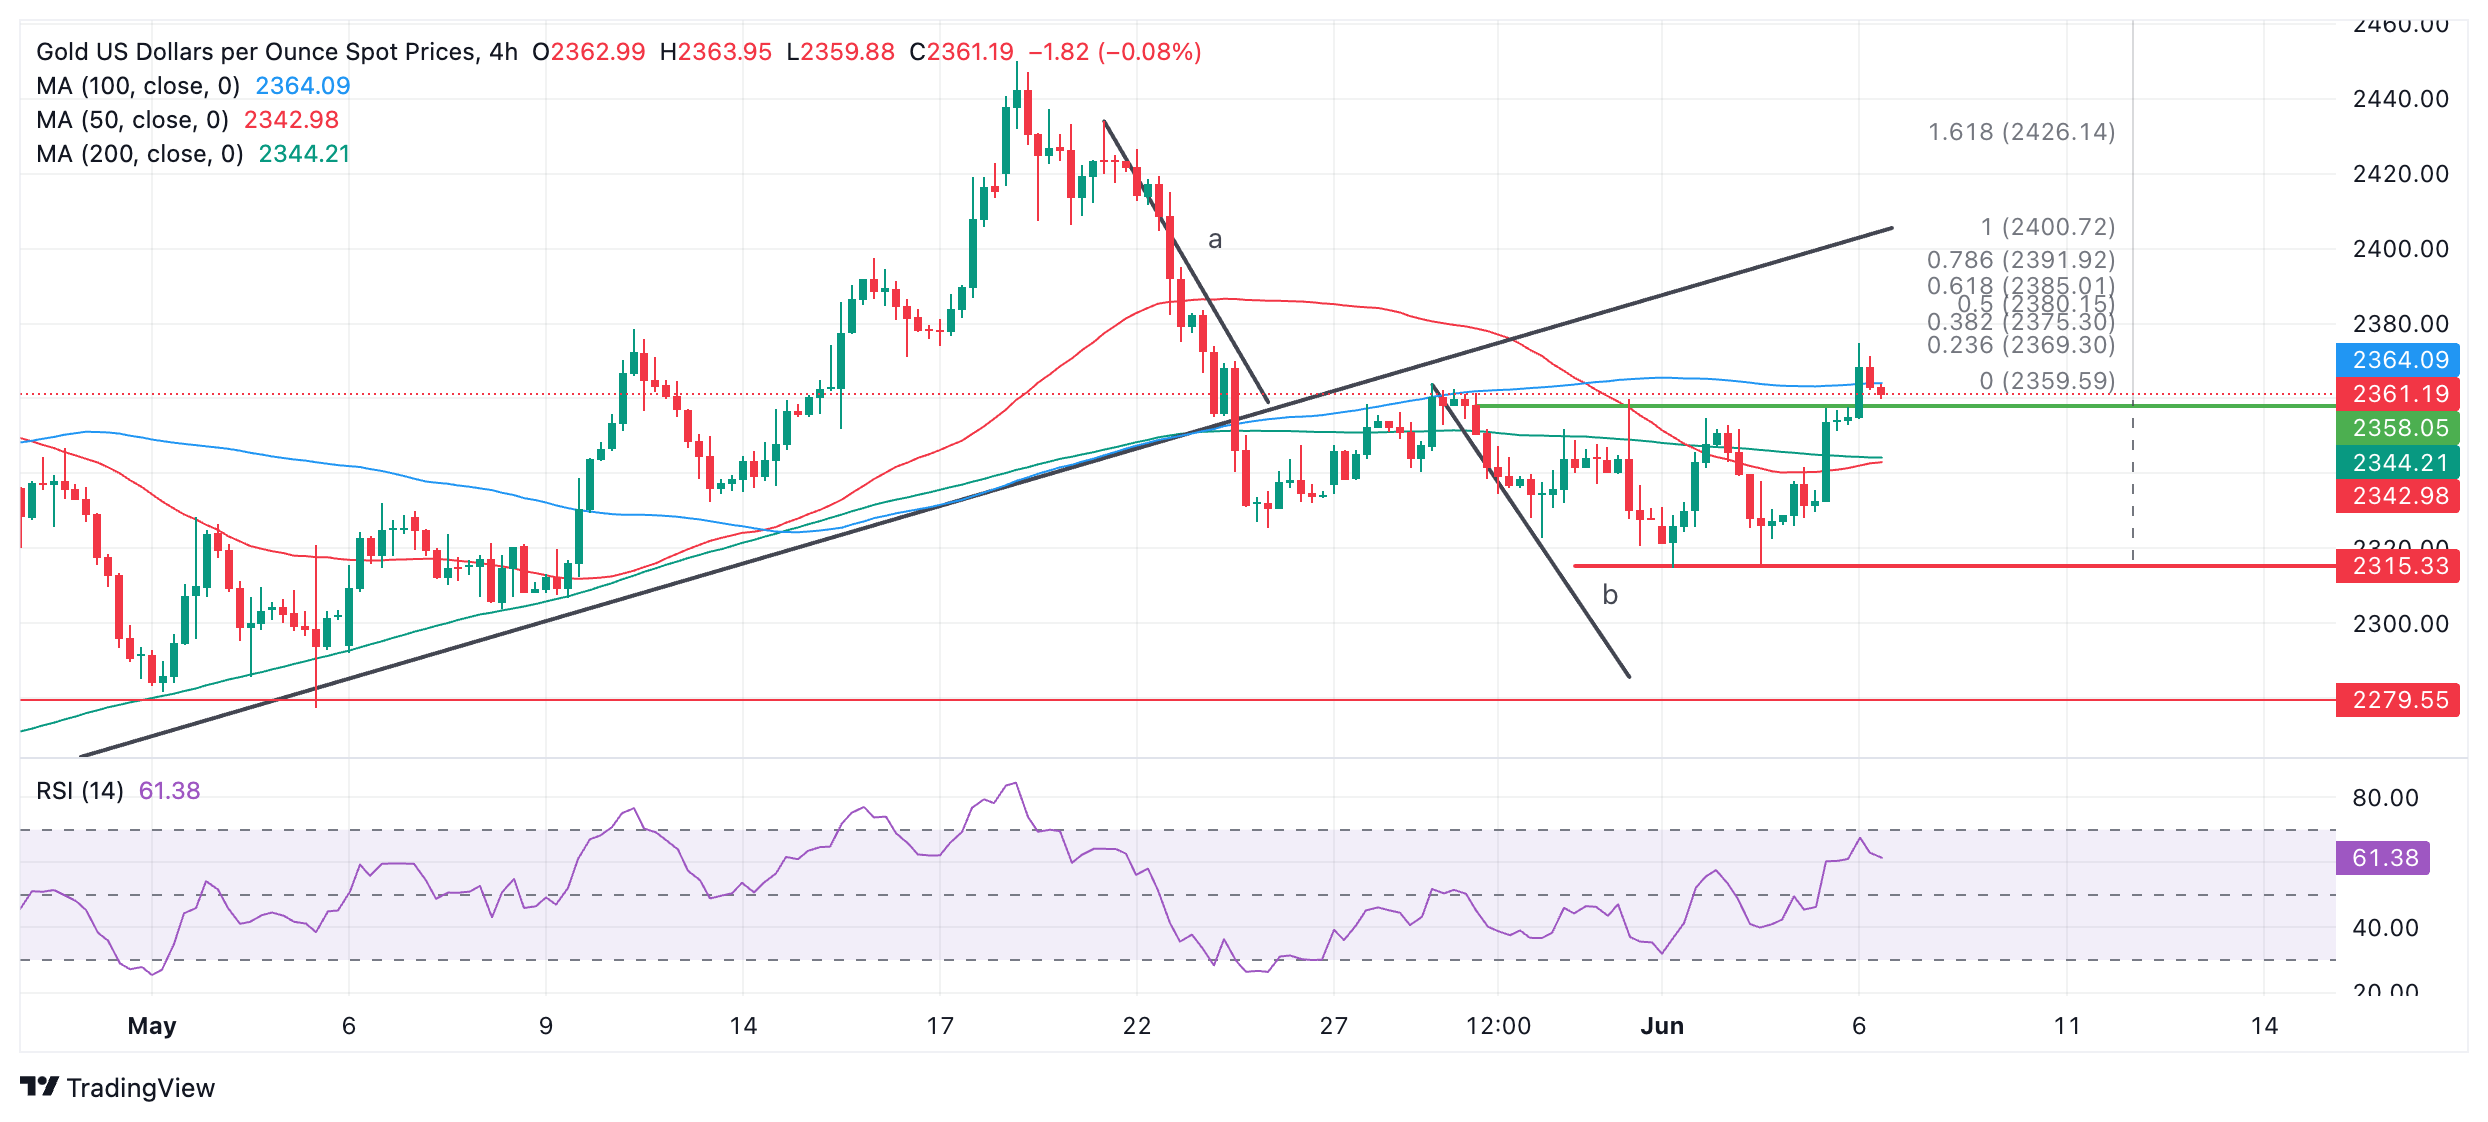
The break below the trendline in May generated downside targets. These are now brought into doubt by the upside break, however, a move back inside the range and then a break below the $2,315 range low would reactivate them.
The length of the move prior to a break can be used as a guide to the follow-through move after a break, according to technical analysis. The first target for the follow-through is at $2,303 – the 0.618 Fibonacci extrapolation of “a”. A stronger move down could even see Gold reach support at $2,279.
The precious metal’s medium and long-term trends are still bullish, and the risk of a recovery remains high.
Economic Indicator
ISM Services PMI
The Institute for Supply Management (ISM) Services Purchasing Managers Index (PMI), released on a monthly basis, is a leading indicator gauging business activity in the US services sector, which makes up most of the economy. The indicator is obtained from a survey of supply executives across the US based on information they have collected within their respective organizations. Survey responses reflect the change, if any, in the current month compared to the previous month. A reading above 50 indicates that the services economy is generally expanding, a bullish sign for the US Dollar (USD). A reading below 50 signals that services sector activity is generally declining, which is seen as bearish for USD.
Last release: Wed Jun 05, 2024 14:00
Frequency: Monthly
Actual: 53.8
Consensus: 50.8
Previous: 49.4
Source: Institute for Supply Management
The Institute for Supply Management’s (ISM) Services Purchasing Managers Index (PMI) reveals the current conditions in the US service sector, which has historically been a large GDP contributor. A print above 50 shows expansion in the service sector’s economic activity. Stronger-than-expected readings usually help the USD gather strength against its rivals. In addition to the headline PMI, the Employment Index and the Prices Paid Index numbers are also watched closely by investors as they provide useful insights regarding the state of the labour market and inflation.
Read more
* The content presented above, whether from a third party or not, is considered as general advice only. This article should not be construed as containing investment advice, investment recommendations, an offer of or solicitation for any transactions in financial instruments.


