Gold Price Forecast: $2,365 appears a tough nut to crack for XAU/USD buyers

Mitrade
coverImg
Source: DepositPhotos

■Gold price consolidates rebound from two-week lows early Tuesday.

■The Dollar meets fresh supply amid sluggish Treasury bond yields and China-led market optimism.

■Gold price recovery stalls below rising wedge support-turned resistance but RSI holds above the 50 level.


Gold price is consolidating its recovery mode from two-week lows, hovering near $2,350 early Tuesday, as traders look forward to the upcoming speeches from US Federal Reserve (Fed) policymakers.


Gold price awaits Fedspeak for fresh cues on rates


Fed Governor Michelle Bowman and Cleveland Fed President Loretta Mester are due to speak at a Bank of Japan’s (BoJ) event titled "Policy Panel Discussion" at 04:55 GMT. Their commentaries will be closely scrutinized by markets for gauging the path forward on interest rates.


The Fedspeak could help revive the US Dollar demand, if the policymakers stick to their cautious approach to inflation, especially after April’s US Consumer Price Index (CPI) report. In anticipation of this, the non-interest-bearing Gold price is treading water, pausing its recovery momentum.


Gold buyers are also taking a breather, as risk sentiment remains in a sweeter spot, courtesy of renewed optimism surrounding China’s embattled property market. China’s Shanghai City announced several measures to prop up the country’s housing market.


However, the extended weakness in the US Dollar is helping Gold price to stay afloat, as they await US traders’ return after a long weekend for fresh trading impulse. Also, in focus will remain more Fed policymakers’ speeches, due later in American trading on Tuesday.


Gold price technical analysis: Daily chart
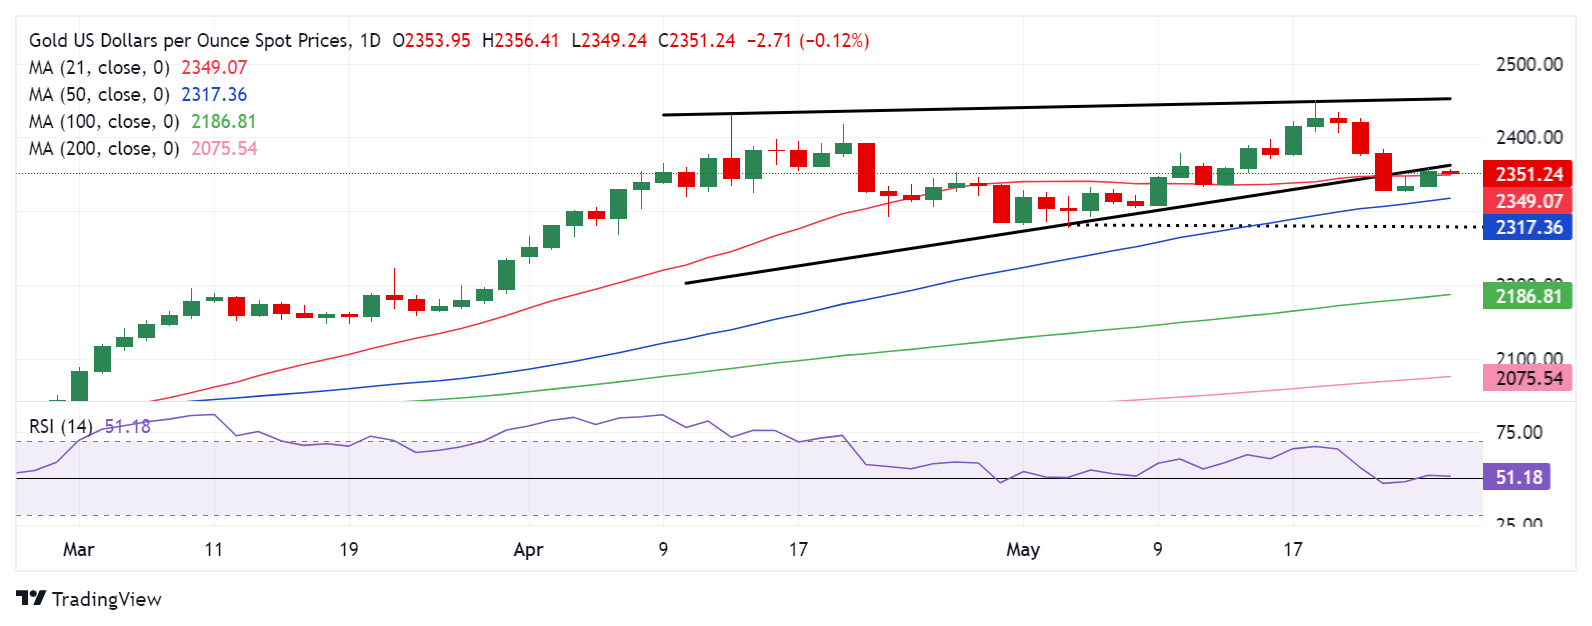


Gold price defied the bearish bias on a rising wedge breakdown on Monday, supported by a positive shift in the 14-day Relative Strength Index (RSI), above the 50 level.


However, the further upside hinges on acceptance above the wedge support-turned-resistance at $2,365 on a daily closing basis.


At the moment, Gold price battles the 21-day Simple Moving Average (SMA) at $2,349, having closed above that level a day ago.


If Gold buyers managed to regain control above the aforementioned barrier at $2,365, a fresh advance toward the May 24 high of $2,384 cannot be ruled out.

The next topside hurdle is seen at the $2,400 mark.


On the flip side, Gold sellers need to crack the 50-day SMA support at $2,317 to resume the downtrend.


The next cushion is aligned at the $2,300 level, below which the May 3 low of $2,277 will be tested.

Read more

  • US October PPI Preview: Fed Rate Hike Expectations Rise, PPI May Be Key Variable; How Will US Stocks, Dollar, and Gold Move?
  • * The content presented above, whether from a third party or not, is considered as general advice only.  This article should not be construed as containing investment advice, investment recommendations, an offer of or solicitation for any transactions in financial instruments.

    goTop
    quote
    Related Articles
    placeholder
    Gold Price Forecast: Gold Tumbles Below $3,900 as Trump Says No Need for Iran Deal; Can October PPI Spur a Rebound? As of the Asian session on Friday (November 13), gold prices (XAUUSD) rebounded intraday following Thursday's sharp decline, trading near $3,910. Previously, gold tumbled 2.76% on Thursda
    Author  TradingKey
    9 hours ago
    As of the Asian session on Friday (November 13), gold prices (XAUUSD) rebounded intraday following Thursday's sharp decline, trading near $3,910. Previously, gold tumbled 2.76% on Thursda
    placeholder
    Gold hit a one-year low while central banks bought 321 tonnes — the sellers were never the ones you thinkSpot gold closed at 3,876 on Thursday, down 2.8% and its lowest close in more than a year, with an intraday low near 3,852. The dollar is at a 19-month high of 103.21 and the 10-year yield is at 5.10%, so the price move is easy to explain. What is harder to explain is who sold: central banks bought 321 tonnes in Q3, the PBoC added for a 24th straight month, ETF holdings are near a record 4,256 tonnes, and roughly 95% of the futures selling came from non-reportable and sovereign-type accounts rather than hedge funds. This piece separates the two books that have to balance.
    Author  Irene Q.
    13 hours ago
    Spot gold closed at 3,876 on Thursday, down 2.8% and its lowest close in more than a year, with an intraday low near 3,852. The dollar is at a 19-month high of 103.21 and the 10-year yield is at 5.10%, so the price move is easy to explain. What is harder to explain is who sold: central banks bought 321 tonnes in Q3, the PBoC added for a 24th straight month, ETF holdings are near a record 4,256 tonnes, and roughly 95% of the futures selling came from non-reportable and sovereign-type accounts rather than hedge funds. This piece separates the two books that have to balance.
    placeholder
    US October PPI Preview: Fed Rate Hike Expectations Rise, PPI May Be Key Variable; How Will US Stocks, Dollar, and Gold Move?On Friday (Nov. 13) Eastern Time, the U.S. will release the October Producer Price Index (PPI). Following the October CPI once again exceeding expectations, the market will look to the PP
    Author  TradingKey
    Yesterday 08: 36
    On Friday (Nov. 13) Eastern Time, the U.S. will release the October Producer Price Index (PPI). Following the October CPI once again exceeding expectations, the market will look to the PP
    placeholder
    Gold closed below $4,000 again — the ETF crowd and central banks stayed, the momentum money leftSpot gold is trading near $3,999, its third consecutive lower daily low, after a 5.00% 10-year yield and a 102.85 dollar index raised the odds of a December hike to 87%. But the selling is not coming from the strategic holders: managed-money net longs fell to 324 tonnes, a 21-week low, and Goldman Sachs attributes roughly 95% of five weeks of selling to non-reportable positions. ETFs still hold a record 4,256 tonnes and central banks bought 321 tonnes in Q3. The table below sets the triggers, directions and levels.
    Author  Irene Q.
    Yesterday 03: 20
    Spot gold is trading near $3,999, its third consecutive lower daily low, after a 5.00% 10-year yield and a 102.85 dollar index raised the odds of a December hike to 87%. But the selling is not coming from the strategic holders: managed-money net longs fell to 324 tonnes, a 21-week low, and Goldman Sachs attributes roughly 95% of five weeks of selling to non-reportable positions. ETFs still hold a record 4,256 tonnes and central banks bought 321 tonnes in Q3. The table below sets the triggers, directions and levels.
    placeholder
    Gold Extends Slide Below $4,000 as Rising US Inflation, Fed December Hike Bets Pressure Prices On November 12, gold prices (XAUUSD) extended their recent losses, falling further below $4,000 in early Asian trading to hit an intraday low near $3,968, marking a third consecutive day
    Author  TradingKey
    Yesterday 02: 00
    On November 12, gold prices (XAUUSD) extended their recent losses, falling further below $4,000 in early Asian trading to hit an intraday low near $3,968, marking a third consecutive day
    Live Quotes
    Name / SymbolChart% Change / Price
    XAUUSD
    XAUUSD
    0.00%0.00

    Gold Related Articles

    • 10 Best Day Trading Platforms for Beginners and Active Traders in 2026: A Practical Guide
    • What is Gold CFD? How to Trade Gold CFD With Mitrade Example
    • ​5 Best Paper Trading Platforms for 2026 (Free Demo Accounts for Beginners & Traders)
    • XAU/USD Gold Price Trend Analysis 2026: Will It Keep Rising?
    • Is Mitrade Right for You? A Complete Guide on How to Start Trading CFDs in 5 Steps
    • How and Where to Buy Gold in Australia? A Complete Guide for Beginners

    Click to view more